


I want to give people a little bit of insight into what the optimization process looks like for Godot’s renderer. From the outside, rendering optimization can look a little bit like black magic. I want to show a few examples of some optimizations that we did this year to highlight that optimizing rendering code isn’t as scary as it sounds.
Bottlenecks
In this article I will only be looking at optimizing CPU code. When working on renderers, you need to be very careful about optimizing code both for the CPU and for the GPU, because your ultimate performance will be dictated by the slower of the two processors. No amount of CPU optimization will save you from inefficient shaders.
In writing a renderer you also make tradeoffs all the time to benefit one or the other. For example, batching in 2D is a technique that hurts GPU performance a little, but improves CPU performance a lot. Since 2D games tend to get CPU bottlenecked before they get GPU bottlenecked, batching ends up being a net positive in most cases. Conversely, 3D games tend to be GPU bottlenecked more often, so in Godot we do our occlusion culling on the CPU in order to take some of the load off the GPU.
Regardless of your ultimate balance between CPU and GPU work, it is always beneficial to optimize the engine since any optimization to the engine leaves more space for game developers to use the CPU and GPU and saves battery power for power-constrained platforms.
Methodology
The process of optimizing CPU performance roughly looks like:
- Identify the performance bottlenecks/hotspots
- Understand why the bottleneck is where it is
- Investigate solutions
- Re-measure performance
- Repeat
Identify the performance bottlenecks
This is the hardest part of performance optimization. When your game or application starts running poorly it can be difficult to track down exactly why. Often once you see where the poor performance is coming from, you immediately understand why performance is bad. This is often the case when you accidentally call an expensive API in a hot loop, or you leave in some debug code that should never have seen the light of day.
For us, as engine developers, we have the added challenge of needing to optimize for a wide range of potential games. We don’t have just one target, we have thousands of moving targets and we only know there is a serious problem when people make bug reports. That being said, we can identify and make many improvements just testing using our existing demos and open-source games.
The best tool for identifying CPU bottlenecks is a CPU profiler. They come in many shapes and sizes. Godot even has two built into the editor (one for profiling GDScript code and another for profiling the renderer exclusively). However, when working on engine code itself, you need to use an external profiler. Godot has support for building with Tracy to do tracing profiling, but you can also use an external sampling profiler.
My tool of choice is Superluminal which is an external sampling profiler. It attaches to a running instance of Godot and records profiling data as you run the engine. Then it provides a very nice visualization of what code is running when. It also recently got Linux support! The examples below in this article will be using Superluminal.
Understand the bottleneck
As mentioned above, sometimes it is easy to understand the bottleneck. Especially when the poor performance is due to a bug and not a poor design choice. Oftentimes understanding the bottleneck requires understanding the surrounding code.
Ultimately performance optimization boils down to “don’t do things that don’t need to be done”. Understanding the code and understanding the system is very helpful to understanding what things need to be done and what things are unnecessary.
Investigate solutions
Typically, once you understand the bottleneck, the solution will seem obvious. But sometimes you need to try a few different things before you figure out exactly what is required. For example, you might see a heavy loop with a lot of calculations in it and initially think the solution is to do less calculations per iteration. But it could turn out that the problem comes from memory bandwidth, so re-structuring your data might yield better performance gains.
Ultimately, you will make changes that directly reduce the impact of the bottleneck.
Re-measure performance
You always need to re-measure. Computers are very complex, game engines are very complex, sometimes the thing you think will be faster is not faster. Optimizations are often counter-intuitive. For example, adding a branch in a for loop to skip some calculations intuitively seems like it will always be faster, but in many cases it stops the compiler from vectorizing the loop and thus leads to worse performance. Or, a more common example, you may cache a value to avoid calculating something twice, but if your bottleneck in that code path is memory reads, then caching the value will make your code slower and you would have been better off doing the work twice.
Unless you are an absolute C++ compiler genius, you likely can’t guess the exact result of your code change on performance. So it is always better to re-measure and confirm your results.
Case Study #1: Polygon2D
This PR came out of a conversation I had with Aurélien Condomines who is working on Heidi’s Legacy: Mountains Calling. He noted that he found the animation code in Godot to be very slow which was limiting his ability to add content to his game. He found that by having 20 or so animated characters, performance would start to fall off in his game.
I was surprised at those numbers and felt that something was wrong. Our animation code shouldn’t be a bottleneck with only 20 or so animated characters so I decided to investigate. I asked him to put together a minimal project with a bunch of animated sprites on screen so I could profile it.
This first hint is that he was using an AnimationPlayer to animate the vertices of a Polygon2D that was displayed on a Viewport on a Sprite3D in order to have nice looking 2D animations in a 3D world.
That alone sounds a bit unique, but it isn’t something that should cause any significant problems. So our next step is to boot up Superluminal and see what is going on.
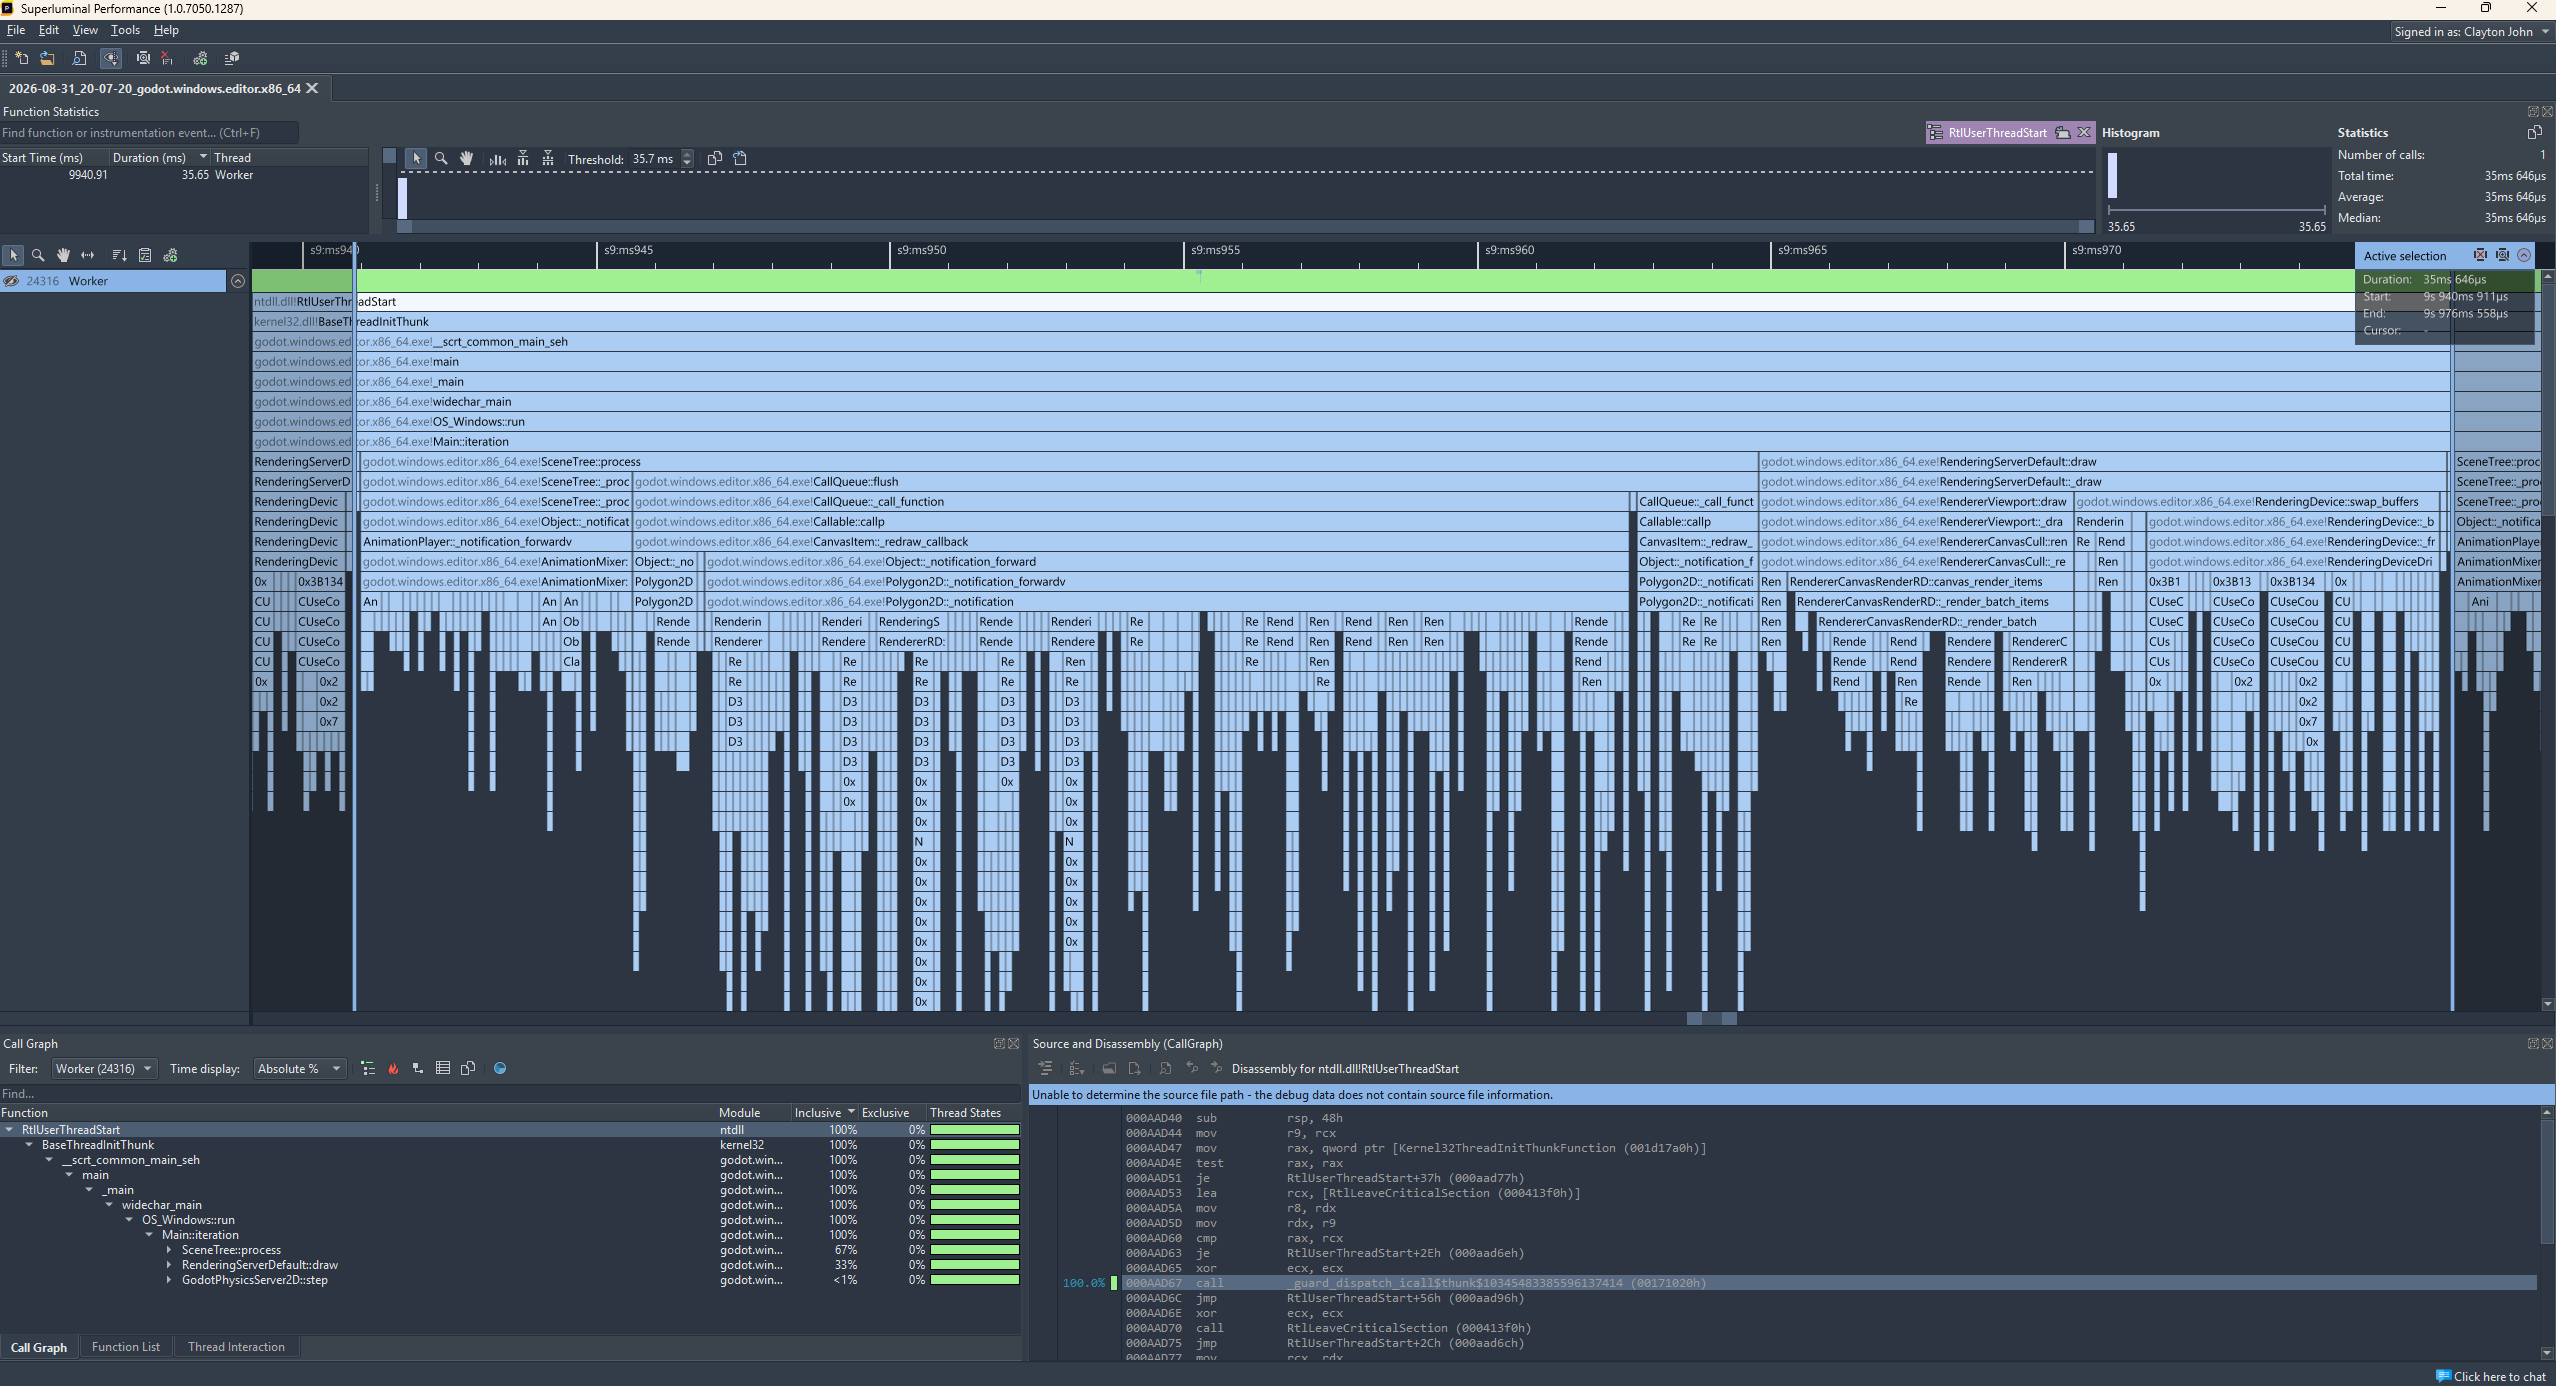
I captured a few seconds of the demo running and then zoomed in on a frame.
Note: all testing of this demo scene is done with a Ryzen 5 9600X CPU.
Since it isn’t totally clear in the screenshot, here is a breakdown of where we are spending our time:
- 4.6 ms: AnimationMixer. That is slower than I would like to see, but there are a lot of animation tracks in this scene since every vertex is being animated, so it isn’t totally unexpected.
- 15.7 ms:
Polygon2D::_notification(). I will say more about this below. - 11.7 ms: Drawing the scene. Of this 3.3 ms is spent creating vertex arrays, and 5 ms is spent freeing vertex arrays. So we only spend about 3.4 ms actually rendering the scene.
With just this high-level overview, we can immediately tell that there are two things going wrong:
- Polygon2D is doing something unexpected.
- Whatever it is, it is resulting in vertex arrays getting created and freed every frame.
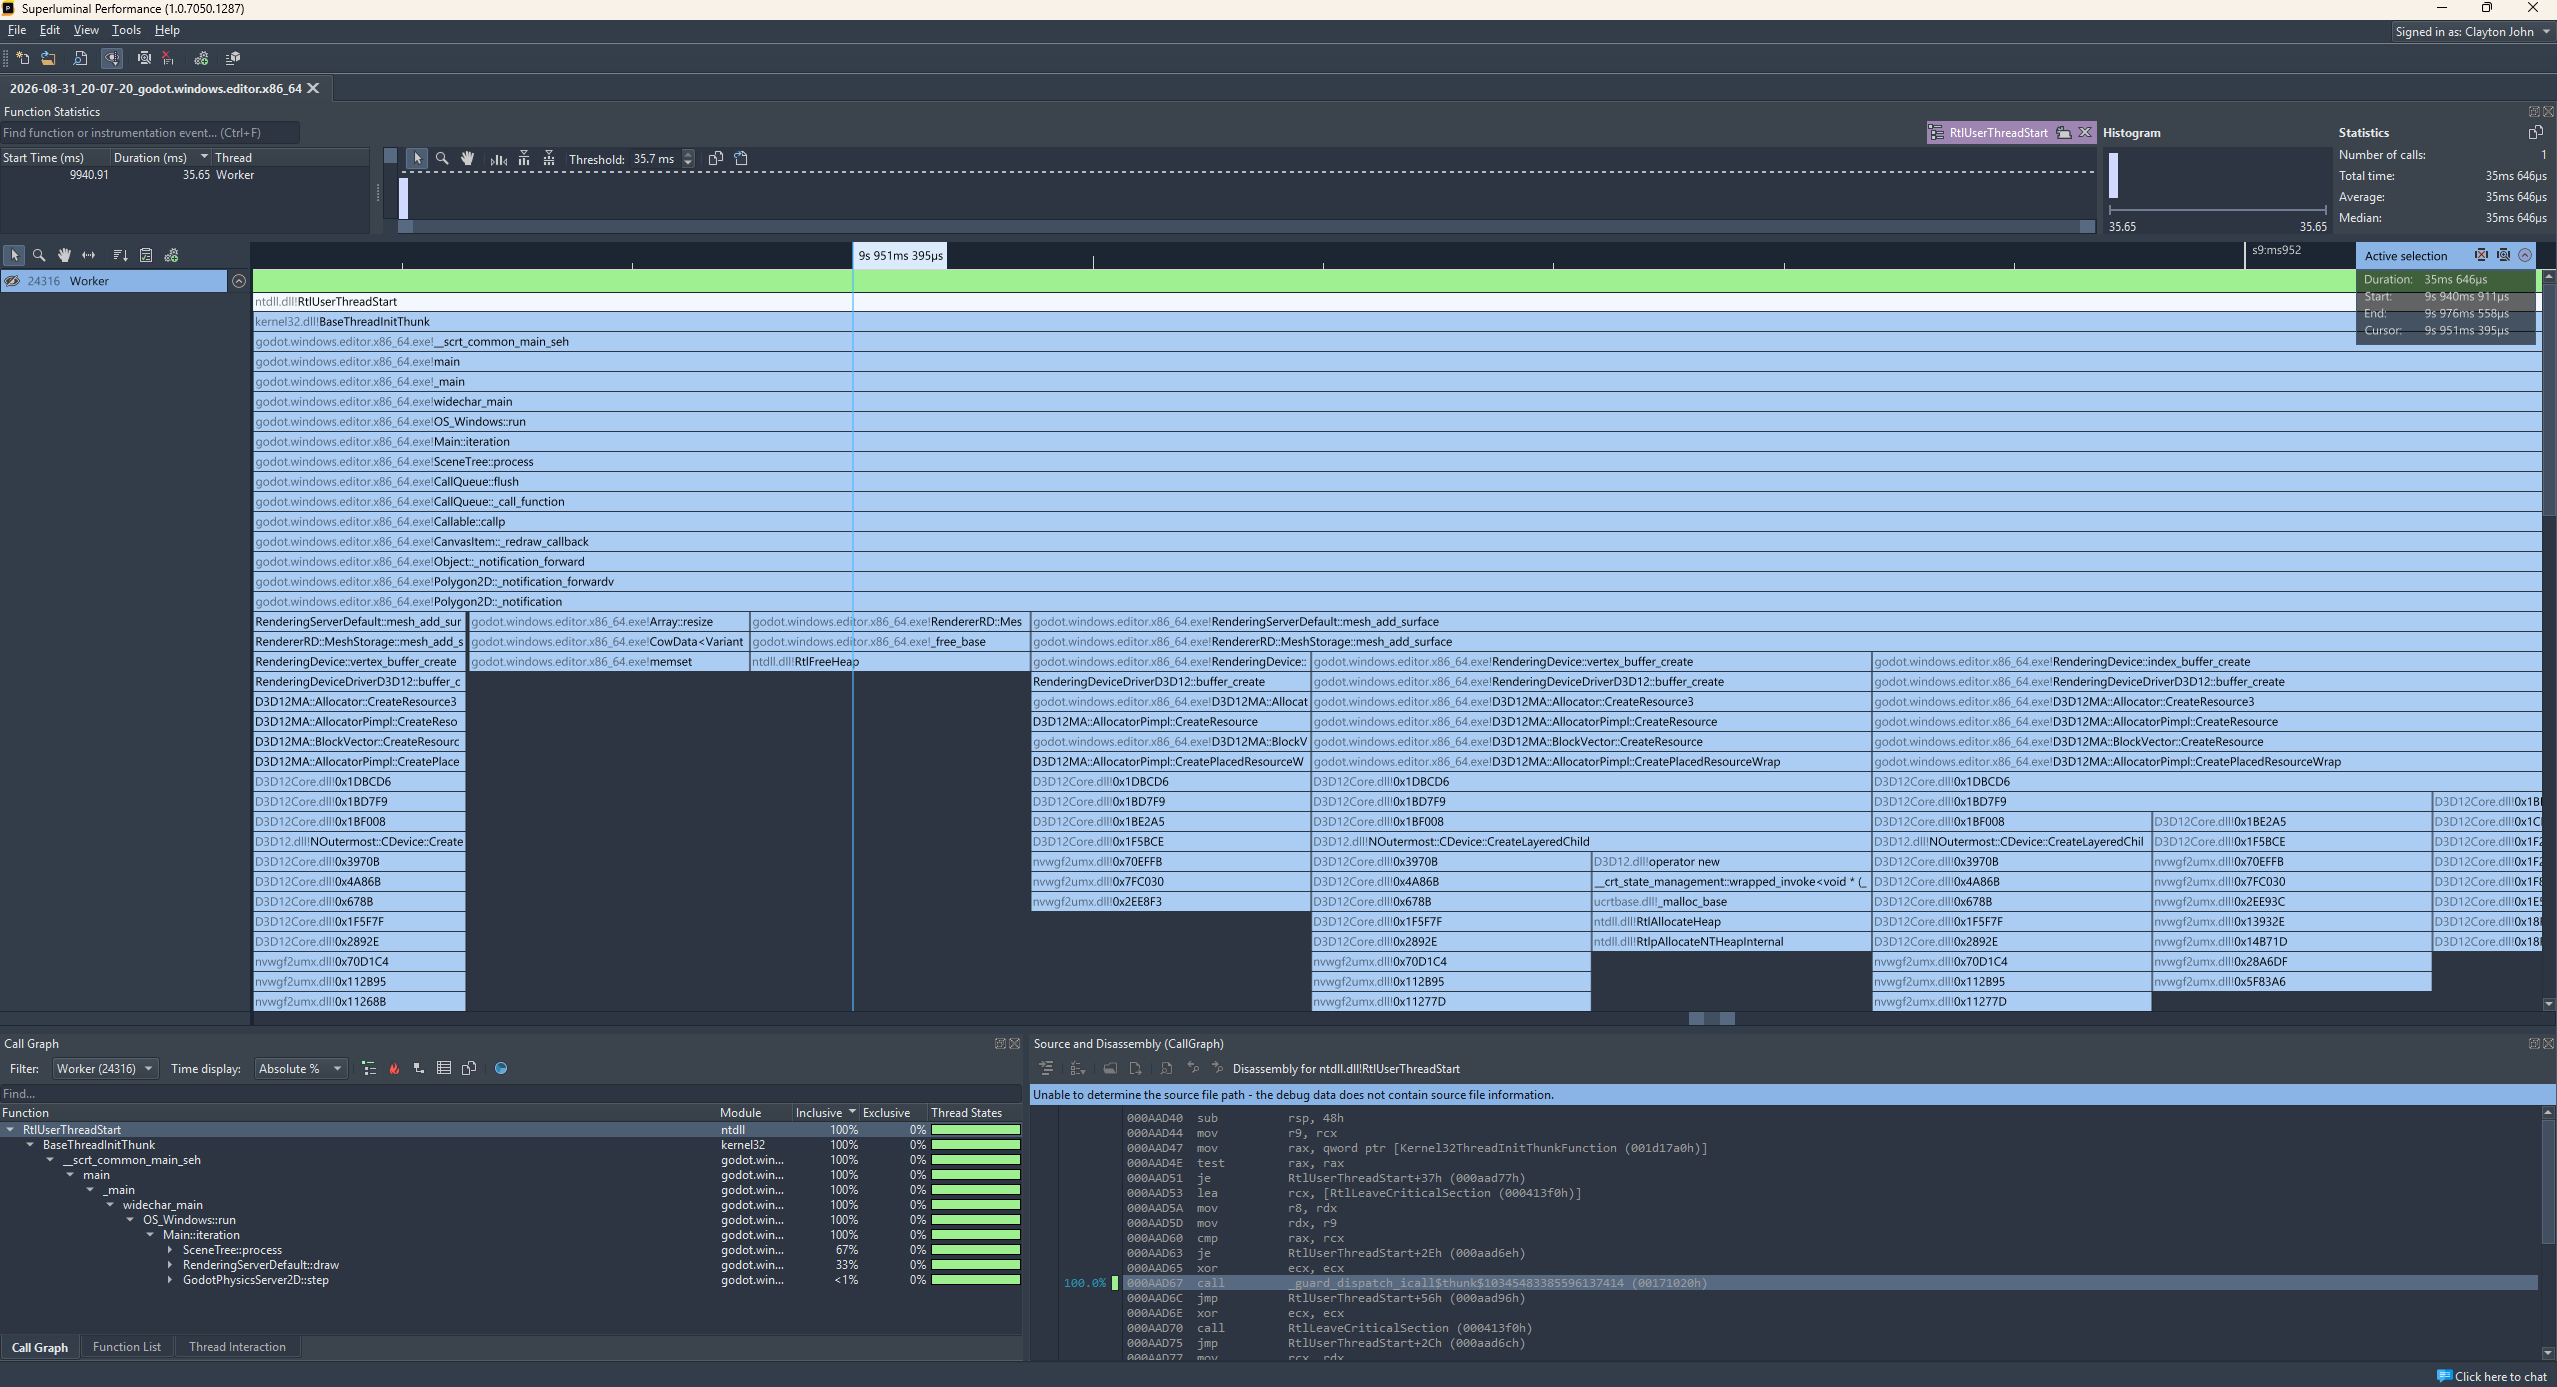
So let’s take a close look and see where the time is spent in Polygon2D. We have two options, we can just zoom in on the timeline, which looks like this:
Or we can use the call graph below to get a more detailed overview:
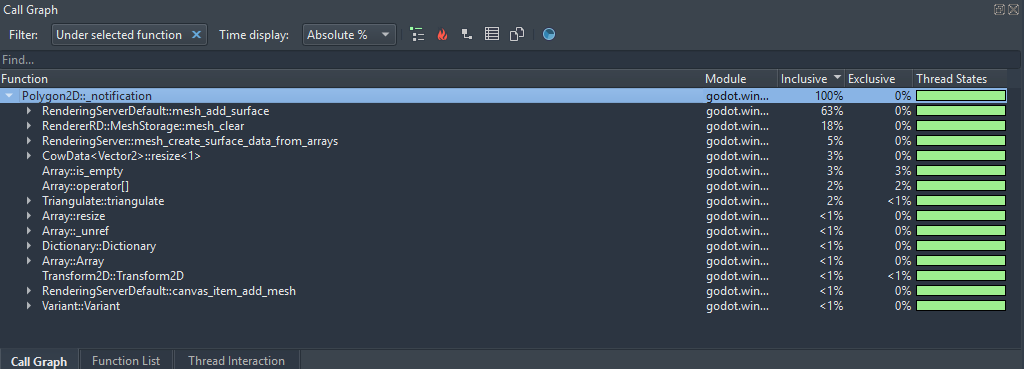
The call graph orders the function calls inside the chosen function by how expensive they are. You can see that most of the time is spent adding a new surface and freeing the previous one. That aligns with what we already saw in the rendering code. Now we know that the Polygon2D class is responsible for the poor performance even at rendering time.
Now, we can look over at the “Source and Disassembly” panel to see exactly what lines of code are responsible:
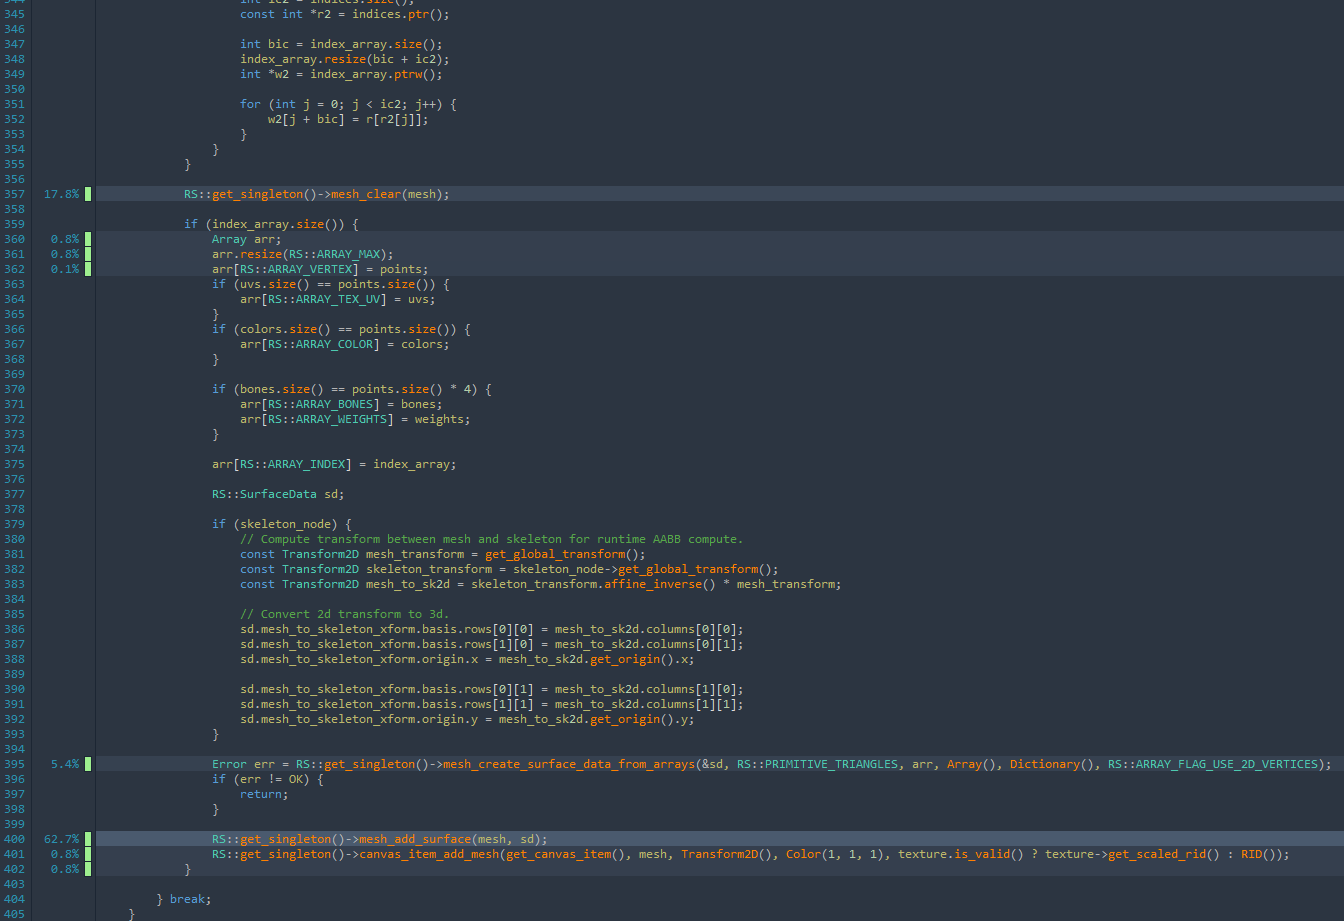
This code is responsible for building the internal mesh for the Polygon2D. This profile is telling us that this code is running every frame and it is very slow. After putting everything together, its no surprise the mesh is being rebuilt every frame, since the vertices are changing on the CPU every frame!
Based on our profile result, we know that is a really slow process. So the question is, can we do something about it?
Of course!
Godot exposes a low-level API to manually update vertex data. This can be extremely helpful when you know the number of vertices in a mesh is going to stay the same. Instead of freeing the old mesh, allocating a new one, and then uploading the vertex data to the new mesh, we can simply upload the vertex data to the existing mesh.
That’s what I ended up doing in my pull request. Most of the work in the PR was identifying which cases were suitable for updating the mesh, and which cases needed the mesh to be recreated.
This optimization roughly tripled the performance of animated Polygon2Ds, making the technique that Aurélien was using totally viable.
Taking a look at a single frame after my PR, we have gone from 35 ms per frame to just 13 ms:
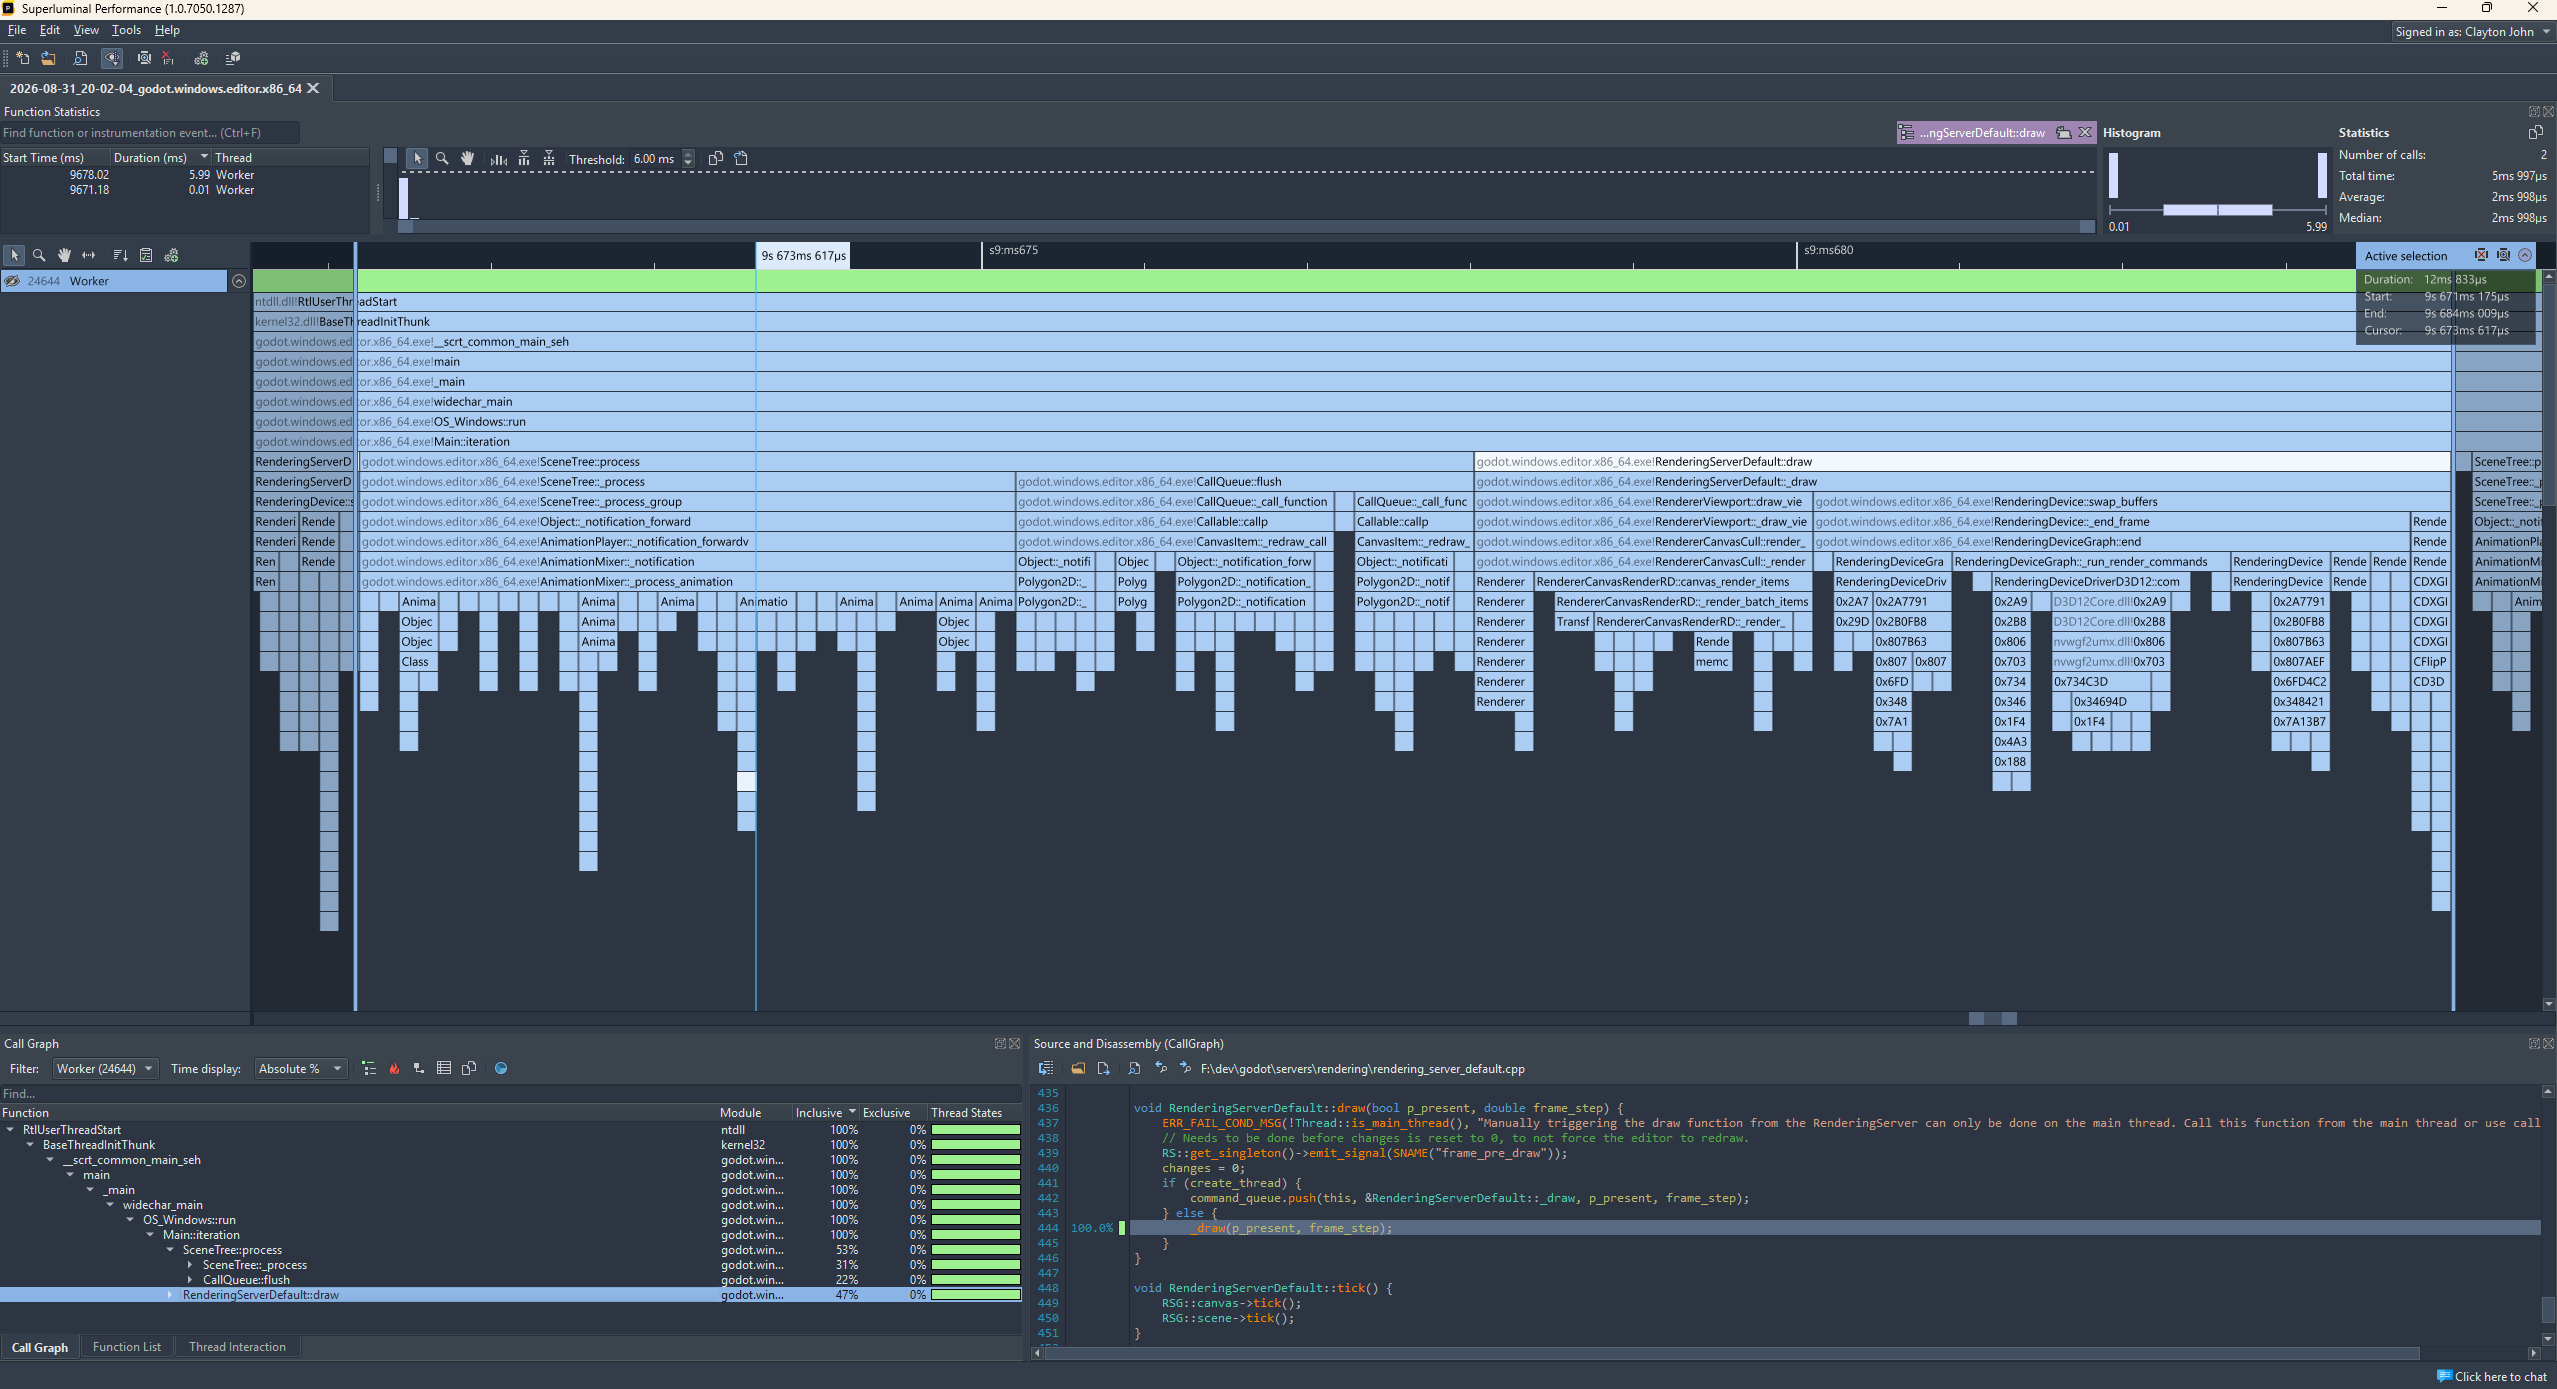
Rendering now accounts for about 50% of the frame time, animation takes about 30% and the Polygon2D update takes about 20%.
This same bit of code could be optimized much further of course. For one, we are re-uploading the entire mesh data each frame that any vertex moves. A potential optimization would be to only update the region of the mesh that changed. That way if you have an animation that only impacts a few vertices, you don’t pay the cost for the full upload.
However, such an optimization would need to be guided by a game or scene that would actually benefit from partial updates. This game basically animates every vertex every frame, so the tracking required to do partial updates would likely be a net negative. Remember, to properly optimize something you need to be able to test your optimization! If you don’t have a test case, you can’t do an optimization properly.
Ultimately, the small and safe optimization I did yielded enough performance gains to go from 28 FPS to 83 FPS on my device. So it was enough for now. If someone was really interested and had the time, performance could be pushed further. Personally, I’m most curious about where we are spending time in the rendering frame now since that accounts for 50% of the frame time.
Case Study #2: Optimizing SPIRV to DXIL Transpilation
Earlier this year, Asilkan was investigating our shader compilation pipeline on the D3D12 backend. Our current method for compiling shaders with D3D12 is described in this earlier blog post from Pedro. In short it is:
- Compile GDShader to GLSL using built in shader compiler
- Compile GLSL to SPIRV using GLSLang
- Transpile SPIRV to DXIL using Mesa’s NIR converter
- Submit DXIL to GPU driver to be compiled to binary
By far the slowest part of the process is the transpilation step. Further, it leads to a noticeable difference in loading times when switching from Vulkan to DXIL since Vulkan can use SPIRV directly.
To optimize this, Asilkan ran a trace through Superluminal and analyzed the results. From a very high level you can already see that there are significant gaps where only a couple of threads are active. Gaps in thread execution mean that things are taking longer than they theoretically should. Ideally our loading process would fully saturate all cores in order to load as fast as possible. That’s the goal anyway.
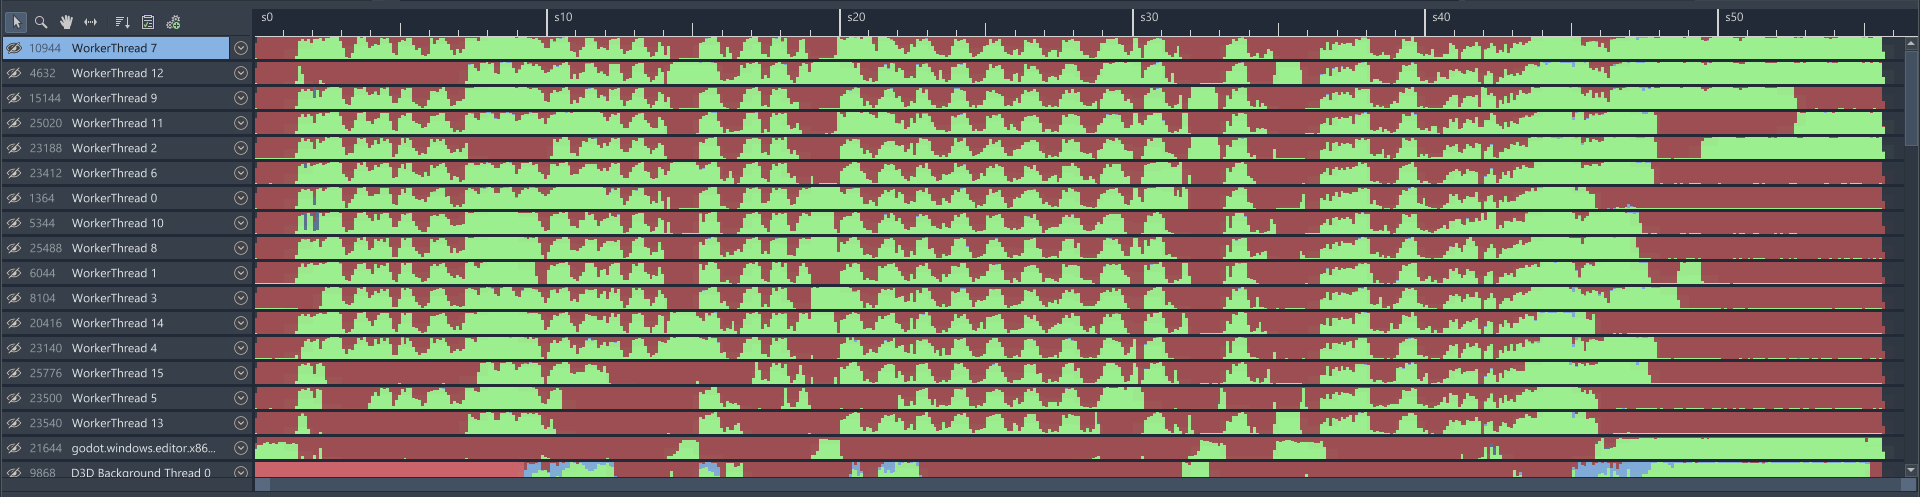
Right off the bat, you can see something is wrong. Green means the thread is doing work. The height of the green bar is basically how hard the thread is working. Red means the thread is stalled waiting for something.
The beautiful thing about a profiler like Superluminal in a situation like this is you can zoom in and see what is happening. Here, Asilkan was able to see that these gaps were all caused by threads requesting more memory from the OS. While the work was heavily multithreaded, all threads ended up waiting on each other while they waited on the OS to allocate more heap memory.
So what if we just didn’t do that?
What Asilkan ended up doing is giving each thread their own heap and getting them to allocate from that instead of frequently asking the OS for more memory from a single global heap. The end result is the threads are no longer stuck waiting for the OS and their execution now looks like:
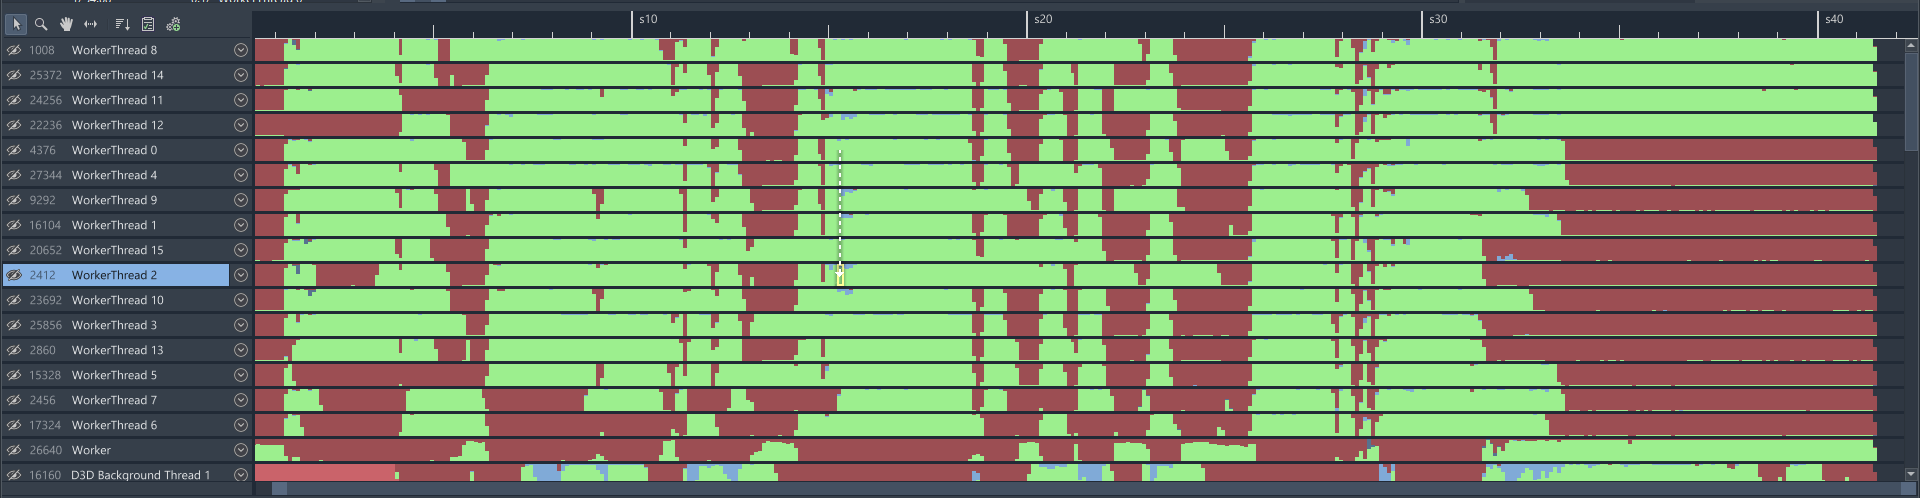
This optimization saved 11 seconds of load time in the TPS demo. Those 11 seconds were purely wasted time where the CPU ended up stalled doing nothing.
Conclusion
I hope this post has helped show what we actually do to optimize components of the renderer. The process isn’t super complicated, especially when you have the right tools on hand. In both cases the solution was very apparent once the problem was properly identified.
Support
Godot is a non-profit, open-source game engine developed by hundreds of contributors in their free time, as well as a handful of part or full-time developers hired thanks to generous donations from the Godot community. A big thank you to everyone who has contributed their time or their financial support to the project!
If you’d like to support the project financially and help us secure our future hires, you can do so using the Godot Development Fund platform managed by the Godot Foundation. There are also several alternative ways to donate which you may find more suitable.