| Attention | Topic was automatically imported from the old Question2Answer platform. | |
| Asked By | toblin |
I’m quite a heavy code to simulate biological cells that multiply in 3D, and I’m using the Profiler Debugger to find code to optimize. I’m overall really pleased with the tool.
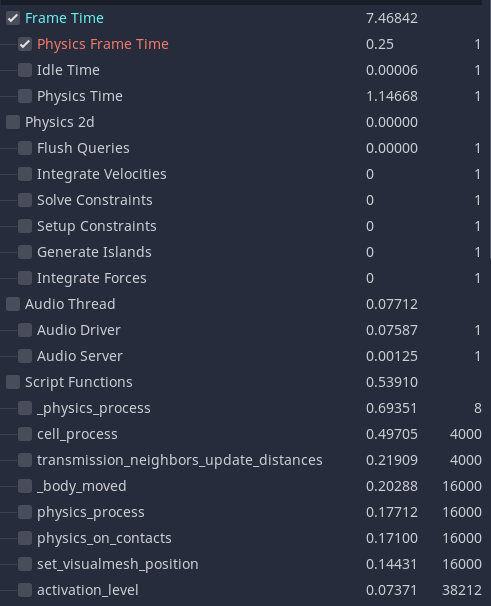
It caught my attention that the Frame Time on top, didn’t (at least on one occasion) not sum up to the time under it. I would not have raised an eye if the difference was negligible (obviously there is some behind-the-scenes that isn’t accounted for), but the difference was striking:
Frame Time = 7.46842 sec

My manual summation of all other process times = 4.87851 sec
Hence around 2.6 seconds were unaccounted for. This is per frame, so it’s a lot of time.
Any ideas what’s going on…?
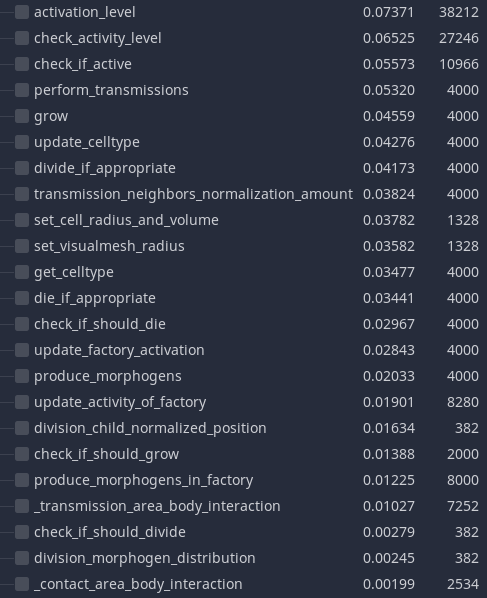
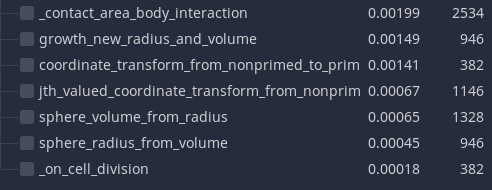
Below are screenshots of the profiler. Note that the top of a consecutive image is the same as the bottom of a prior image to demonstrate that no process has been omitted.