Edit of asset "TauPlot - Charts & Plotting Addon" Accepted
| Old/Current | New/Edit | |
|---|---|---|
| Title | TauPlot - Charts & Plotting Addon | TauPlot charting addon |
| Description |
TauPlot is a charting and data visualization addon for Godot 4.5+. Create bar charts, scatter plots, multi-series graphs, live dashboards, and multi-pane (subplot) layouts directly inside any Godot UI. Pure GDScript, no external dependencies, fully themeable. Use it for in-game analytics, telemetry overlays, scientific plots, sensor readouts, debug HUDs, financial views, or any tool that needs interactive charts. TauPlot is actively developed and the chart catalogue is growing, with line, area, pie, and radar plots on the roadmap. Features: - Bar charts and scatter plots can be combined freely in one chart. Bars support grouped, stacked (with optional normalization), and independent layout modes. - Full Godot theme integration with a three-layer cascade (built-in defaults, Godot theme, code overrides) so charts match the rest of your UI without per-property work. - Categorical and continuous axes with linear or logarithmic scales, axis inversion, and custom tick label formatting. - Automatic tick and tick label generation with overlap prevention, so axes stay readable at any plot size without manual tuning. - Real-time data streaming powered by ring-buffer datasets. The chart redraws incrementally as samples arrive and the oldest points are dropped when the buffer is full. - Multi-pane layouts (also known as subplots) for stacked graphs that share an X axis but use different Y scales. - Hover inspection with tooltip, crosshair, and sample highlight, plus four signals (sample_hovered, sample_hover_exited, sample_clicked, sample_click_dismissed) so you can wire chart interaction into your own UI. - Per-sample visual control over color, alpha, marker shape, marker size, and outline, set either through attribute buffers or callbacks. - GPU-accelerated scatter rendering built on Godot's MultiMesh, with seven built-in marker shapes (circle, square, triangle up and down, diamond, cross, plus). - Configurable legend with placement inside or outside the plot area and configurable flow direction. Requires Godot 4.5 or later. |
TauPlot is a pure GDScript charting addon for Godot 4.5+. No external dependencies. Interactive, performant, and fully themeable. TauPlot draws XY plots inside any Godot UI. It supports bar and scatter overlays (with more to come), real-time data streaming, multi-pane layouts, per-sample visual control, and deep integration with Godot's theme system. Features: - Bar and scatter overlays in any combination within a single plot. Bars support grouped, stacked (with optional normalization), and independent modes. - Categorical and continuous axes, with linear or logarithmic scales, axis inversion, tick formatting callbacks, and automatic label overlap prevention. - Real-time streaming with ring-buffer datasets. When the buffer is full, the oldest sample is dropped automatically. - Multi-pane layouts for displaying series with different Y scales side by side (e.g. price above volume). - Per-sample styling through attribute buffers or callbacks. Control color, alpha, marker shape, marker size, outline, and more on a per-sample basis. - Godot theme integration with a three-layer cascade: built-in defaults, Godot theme, code overrides. Every visual property participates in this cascade. - Hover inspection with configurable tooltip, crosshair, and highlight. Four signals (`sample_hovered`, `sample_hover_exited`, `sample_clicked`, `sample_click_dismissed`) let you react to user interaction. - GPU-accelerated scatter rendering using MultiMesh and a custom SDF shader. Seven built-in marker shapes (circle, square, triangle up/down, diamond, cross, plus) with per-sample shape assignment. - Legend with configurable placement (inside or outside the plot) and flow direction. |
| Category | 2D Tools | 2D Tools |
| License | BSD-3-Clause | BSD-3-Clause |
| Repository Provider | GitHub | GitHub |
| Repository Url | https://github.com/ze2j/tau-plot | https://github.com/ze2j/tau-plot |
| Issues Url | https://github.com/ze2j/tau-plot/issues | https://github.com/ze2j/tau-plot/issues |
| Godot version | Godot 4.5 | Godot 4.5 |
| Version String | 0.1.2 | 0.1.0 |
| Download Commit | ffe27921f030433abfb6afb2ea1f8c8c5ea5e7f6 | 479fbbbcd40e55059f972082ca36b51be983eba2 |
| Download Url (Computed) | https://github.com/ze2j/tau-plot/archive/ffe27921f030433abfb6afb2ea1f8c8c5ea5e7f6.zip | https://github.com/ze2j/tau-plot/archive/479fbbbcd40e55059f972082ca36b51be983eba2.zip |
| Icon Url |
https://raw.githubusercontent.com/ze2j/tau-plot/refs/heads/main/documentation/docs/assets/tau-plot-color.png
|
https://raw.githubusercontent.com/ze2j/tau-plot/refs/heads/main/documentation/docs/assets/tau-plot-color.png
|
| Preview Insert | ||
|---|---|---|
| Type | image | |
| Image/Video URL |
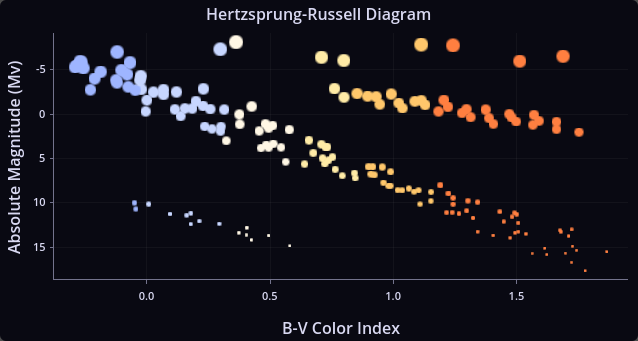
https://raw.githubusercontent.com/ze2j/tau-plot/refs/heads/main/documentation/docs/assets/hr_diagram.png
|
|
| Thumbnail |
|
|
| Preview Insert | ||
|---|---|---|
| Type | image | |
| Image/Video URL |
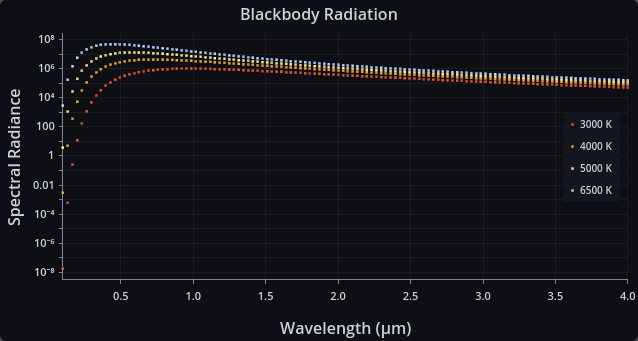
https://raw.githubusercontent.com/ze2j/tau-plot/refs/heads/main/documentation/docs/assets/black_body.png
|
|
| Thumbnail |
|
|
| Preview Insert | ||
|---|---|---|
| Type | image | |
| Image/Video URL |
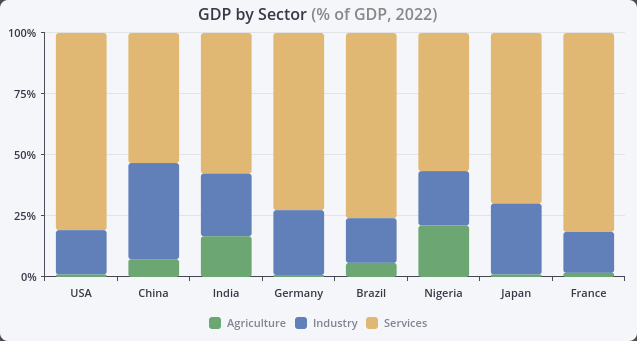
https://raw.githubusercontent.com/ze2j/tau-plot/refs/heads/main/documentation/docs/assets/gdp.png
|
|
| Thumbnail |
|
|