Darío, the author of this article, is a new face around this blog who was hired by W4 Games last summer to start contributing to the project. His work was kindly sponsored and donated to the Godot Engine project by W4 Games. You can find more of his contributions to the engine in his GitHub profile.
Since the introduction of Godot 4, RenderingDevice has been the backbone of the Forward+ and Mobile renderers. Making APIs that are both easy to use and flexible enough to cover all the features users want in a game engine is a very difficult task. The high level of detail expected by APIs like Vulkan or Direct3D 12 compared to their predecessors is worthy of a few blog posts of its own. This article will try to keep the topic as brief as possible to focus on the problems solved within Godot instead.
With the goal of reducing the difficulty of the development of the new renderers and allowing the GPU to parallelize work more effectively, the automatic construction of a directed acyclic graph (DAG) during rendering has been introduced at the lowest levels of the engine. This change is already merged in the main development branch of Godot and should be part of the 4.3 release. The introduction of the graph will bring both performance improvements and various bug fixes for issues that were very difficult to investigate. For example, after the graph was merged it was discovered that MSAA with SSAO will no longer cause artifacts in AMD Polaris (#61415), despite no effort being spent towards developing a specific fix for the problem.
No changes are expected from users whatsoever. If you’re one of the few people who have written code that uses RenderingDevice, there’s no need to worry either: while the API has changed slightly, all of the methods just require less information than before. What level of performance improvement you see will very much depend on the contents of your project. For example, GPU particle systems will get massive improvements, while more standard scenes that use post-processing will see some frametime reduction in the ballpark of around 5% to 15%. On top of that, the Godot developers will have a much easier time improving the performance of the renderers in the near future.
If you’re interested in the details of how this was achieved, keep on reading.
Background
Understanding the problem space is crucial to do a deep dive into the technical decisions that were made. Dealing with an existing codebase for a general engine that had thousands of lines written on top of an existing API imposes many restrictions on what sort of changes are allowed. Flaws introduced in the early stages of design can have long-term effects on the development of a big project. This was very much the case with some of the key decisions taken for the RenderingDevice abstraction, its coupling to Vulkan and the negative results on the rest of the codebase. The good news is it’s never too late to go back to the drawing board. reduz laid out the plans for this redesign during the end of 2023 and the team got to work on how to make it a reality.
Vulkan
There’s a few Vulkan concepts that must be understood before digging into why RenderingDevice was designed the way it was for Godot 4 and the difficulties it encountered along the way.
Command buffers
Recording work for the GPU and submitting it for execution is a very explicit operation in Vulkan. Command buffers (or command lists in D3D12) are the objects where all the recorded work is stored that will be executed at a later point on the GPU. These buffers can grow as much as the user desires and they won’t be run until they’re submitted for execution to a command queue. This implies it’s essentially possible to record from multiple sources, even multiple threads, and submit the work to the GPU once it’s ready with proper synchronization.
Render passes
Drawing something with Vulkan requires a lot of information upfront in the form of a “render pass”: an object that contains references to the textures that the GPU will use as targets, their initial and final states (texture memory layouts) and much more. This is a stark contrast from older APIs like OpenGL or even D3D12, where the render target can be changed during command recording and does not require the creation of an object ahead of time. While a render pass is active, there are also various restrictions on what operations can be recorded on the command buffer. The render pass must end before being allowed to use all types of operations again.
Barriers
The biggest change compared to previous APIs is that synchronization between commands is no longer automatically deduced by the driver and instead must be manually implemented by the programmers using Vulkan. If you want to read more about this topic in detail, I highly recommend Hans-Kristian’s blog post about Vulkan Synchronization and reading the official Vulkan documentation. To keep the article short, a very basic explanation is provided below.
The order of execution of the recorded commands inside a command buffer is NOT guaranteed to complete in the order they were submitted: the GPU can reorder these commands in whatever order it thinks is best to complete the job as quickly as possible. To compensate for this, the programmer must manually insert synchronization barriers in the command buffer that allow specifying in detail which commands should be completed or started by specifying the scope before and after. The scope includes multiple concepts such as the execution stage (e.g. drawing, compute, transfer), the type of access (e.g. read or write) and the affected memory regions (globally, buffers or textures). On top of that, barriers are capable of transitioning textures from one memory layout to another, which is a requirement to be able to use textures in different commands optimally.
 |
|---|
| A barrier can establish a dependency between commands by specifying a synchronization scope. |
Beginners will have a hard time understanding this mechanism, but even experts or hardware vendors are not safe from making mistakes. A run of the Vulkan Validation Layers in synchronization mode will reveal multiple issues on most Godot projects or even commercial games available in the market. These are among the most frustrating issues to understand as they won’t even appear consistently depending on hardware vendor or hardware speed. Since eliminating these problems was one of the main goals behind the introduction of the acyclic graph, extensive use was made of these validation tools to ensure that no synchronization errors remained.
RenderingDevice
RenderingDevice is the abstraction on which the Forward+ and Mobile renderers in Godot were built. It exposes an interface that provides a reasonable level of control over the GPU in a way that is not as fine-grained as Vulkan or D3D12 but is also not as “stateful” as OpenGL. More of the rendering state needs to be defined in advance, and the chances of causing an error by leaking state from one previous command to the next are significantly reduced.
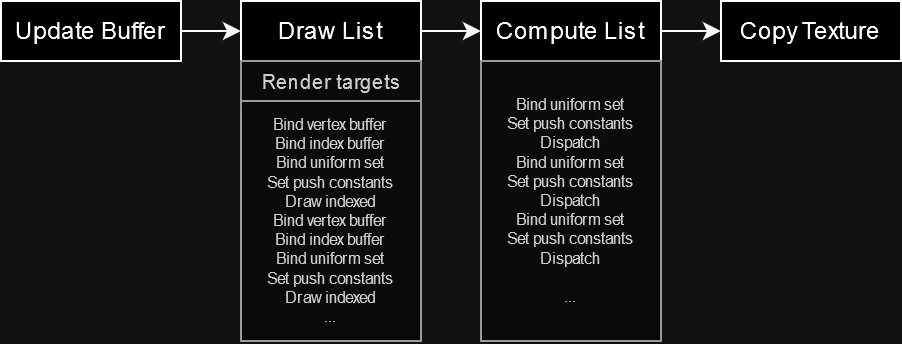
The commands exposed by this class are what you usually expect out of a rendering API: creating resources, copying, clearing, drawing, dispatching compute work, etc. However, the point of interest is how both rendering geometry and compute passes are organized. Godot already has the concept of “draw lists” and “compute lists”: essentially batches of commands describing what to do inside a render pass or a compute pass. The one-to-one correlation between lists and passes is very important, as it significantly reduced the number of nodes an automatic graph would have to create.
 |
|---|
| Draw lists and compute lists are considered a single unit of work in the rendering pipeline. |
While Rendering Device attempted to hide many of the difficulties that Vulkan introduced, there are a few that slipped through that made writing rendering code for Godot 4 more difficult than anticipated.
Draw list actions
Just as draw lists were naturally mapped to render passes, so too was the fact that the start and end action had to be specified for the textures associated with them. These actions cover operations such as loading the contents of a texture, discarding it or clearing it with a specific color. There’s plenty of performance to be gained by choosing the optimal option in each render pass. However, due to some internal design decisions, the introduction of a CONTINUE action was made that doesn’t actually exist in Vulkan. This action essentially meant “the previous draw list is compatible and the texture should not be transitioned to a different state”. For an engine like Godot, which must provide a lot of optional post-processing effects and drawing layers, this proved to be a maintenance nightmare, ending in a ton of branching in the code that was not very easy to follow and prone to mistakes.
Draw list storage textures
Since the device doesn’t know if the result of a draw list will be used in a compute pass later, it was necessary to specify which textures needed to transition to the “storage” memory layout at the end of the render pass. Storage is the layout required for modifying textures directly from compute passes. From the point of view of an outsider to Godot, there was no clear reason why this had to be part of the API, but when analyzing the implementation it was evident it was introduced to deal with the barrier transitions required by Vulkan. In turn, this delegated the responsibility to the programmer to keep track of whether the textures would be used later in the compute passes in order to handle them efficiently.
Draw and compute list overlap
Draw lists and compute lists were allowed to specify whether they can “overlap” during execution. This is a very vague argument that depends on whether the programmer correctly understands whether the render and compute work aren’t dependent on each other and could realistically run in parallel. With no real way to validate this, this flag essentially meant “turn it on and hope for the best” as it simply skipped some synchronization steps that the default behavior enforced. Once again, making use of this feature introduced some issues in the codebase where it would require tracking whether parallel work was being submitted or not: components like GI could make use of this optimization, but whether the feature is used or not depends on what that the user has enabled in the scene.
Barrier mask
While RenderingDevice does not provide explicit access to barriers, a lot of methods would allow specifying a bit mask to define which stages of the pipeline the command must synchronize with. However, this was probably one of the most misused masks in the existing rendering code as its implementation wasn’t even consistent in most methods. In one instance, a variable that wasn’t a bitmask at all was accidentally casted as one and passed to a rendering method.
By default, most commands will just specify that all work that comes afterwards must be executed after the current command has finished. As expected, this results in Godot issuing an extreme amount of barriers “just in case” as it has no knowledge of what might be requested afterwards. Godot’s strategy essentially boils down to issuing barriers to make sure no future work executes before the current command finishes, unless the programmer using RenderingDevice specifies the barrier mask. Again, that means the developer must have exact knowledge of everything that comes next, and in turn, caused another round of maintenance issues. Therefore, this feature is rarely used and the default behavior is preferred, resulting in lower performance.
Hindsight is 20/20
The problems raised here may not have sounded so bad in the planning stages of Godot 4, but they clearly became increasingly difficult to solve as more rendering code was written on top of it. Being tasked with writing driver-level work in addition to refactoring the entire engine in many areas is a very difficult task, especially when new APIs have a much steeper learning curve. Many frameworks and engines have iterated on their solutions to deal with the new amount of work expected by Vulkan, and it was time for Godot to try to address this problem again.
Solution
Preparation
Solving the problems identified above does not actually require the introduction of an acyclic graph: inserting synchronization barriers and performing dependency tracking is entirely possible without applying this technique. This was actually debated internally for a while, but it was determined that if the engine was able to reorder commands, it’d allow for grouping them more effectively between the mandatory synchronization points and would result in better performance.
However, being able to reorder commands meant that an intermediate step had to be introduced where commands were recorded into an auxiliary structure that could be reordered and then converted to the corresponding native API commands. One possibility was encoding the Vulkan command arguments into the auxiliary buffer, but that approach meant the entire graph structure and logic would need to be implemented for every other backend as well. Therefore, it was deemed it’d be necessary for Pedro to work on his pull request that introduces an abstract interface for all the supported graphic APIs, including Vulkan, D3D12 and Metal in the near future. Thanks to this change, it was possible to use a single abstract API to encode commands into the auxiliary buffer.
The initial redesign was laid out in reduz’s draft, which was largely inspired by Pavlo Muratov’s “Organizing GPU Work with Directed Acyclic Graphs” and showed the possibility of how the concept could be applied to Godot’s existing design. Not everything stated in the document made it into the final version: in fact, the changes to RenderingDevice were much less severe than initially indicated and the interface remained largely compatible. While the article that was used as inspiration includes a very detailed algorithm in how to implement multi-queue submission by using the graph, the team made the decision to cut this idea short and stick to a single command queue to begin with, as the difficulty of the task would come from building the graph automatically and would already take a significant amount of development time.
Acyclic graph
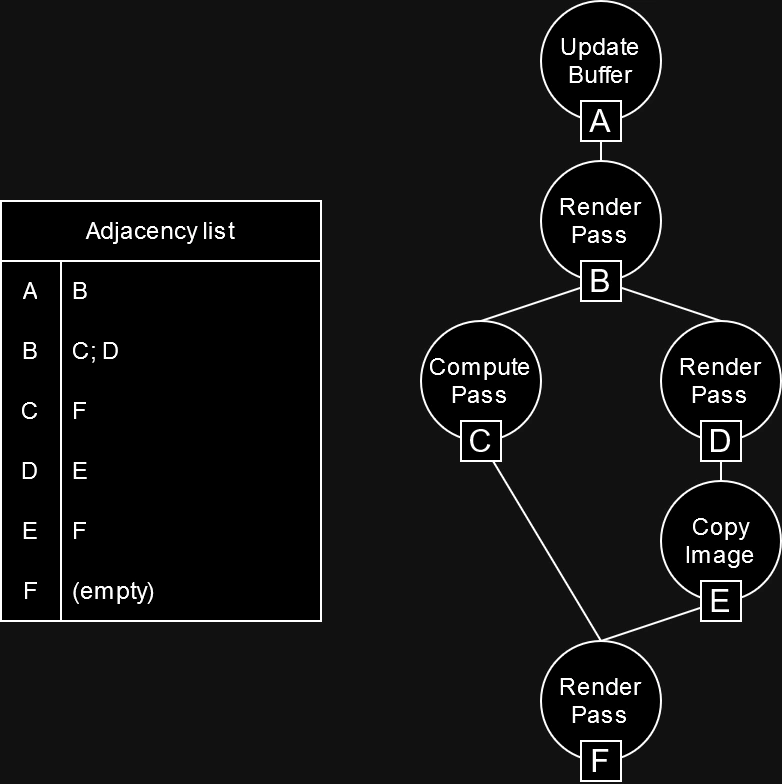
The unique aspect of the implemented graph is that its construction is completely invisible to the programmer using RenderingDevice. Commands requested from the class are logged internally and each command maintains an adjacency list that is updated as new dependencies are detected. Since these adjacencies only work one way and older commands cannot depend on future commands, it is virtually impossible for cyclic dependencies to form (hence the “acyclic” part of the graph). While a graph can be constructed in many ways, a list of vertices and an adjacency list are sufficient. Render commands play the role of vertices, and commands store the indices of their adjacent commands.
 |
|---|
| The rendering operations of a frame and their dependencies represented as a graph. |
An important decision that was made to allow this structure to scale more effectively is that each instance of a draw list or a compute list are considered as one node in the graph. There is no benefit to allowing reordering within these structures and Godot already has a clear concept of what these lists are used for. Games often draw a lot of geometry, but they don’t create tons of render passes per frame, as that doesn’t result in efficient use of the GPU. To put it in numbers, one of the benchmark scenes used during testing could easily reach hundreds of thousands of nodes if each individual command was recorded into the graph. Making the distinction to correlate render passes to individual nodes brought this number down to about 300 nodes per frame. Operating with a graph of this scale was a very good sign that the performance overhead would be very small.
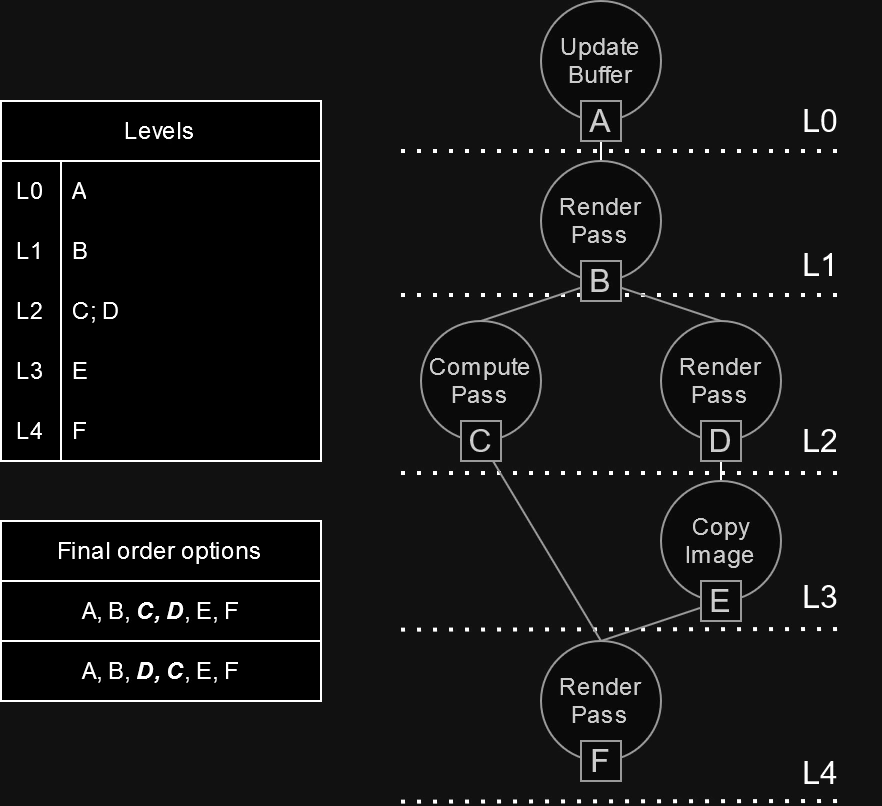
Once all commands for the frame have been recorded, a topological sort is performed on the graph to get an ordered list of commands. During this step the “levels” of the commands are detected to determine how they can be grouped and where synchronization points (barriers) should be introduced. All commands belonging to a particular level in the graph can be executed in parallel as no dependencies have been detected between them, meaning that no barriers are required until the next level is reached. This sorting step is where the magic behind the performance gains happens.
 |
|---|
| After sorting, all commands that belong to the same level can be executed in any order, resulting in multiple possible command sequences. |
One important detail that resulted in frametime reductions during this step was to take into account the type of command as a sorting factor: grouping together operations based on whether they were related to copying data, drawing or compute dispatches provided some noticeable increases in performance. While the exact reason behind this has not been determined, it seems likely that GPUs prefer to change the type of pipeline they need to use within a command buffer as little as possible.
While the concept of using a structure like a graph and using sorting algorithms might sound like the most daunting part of the task due to the level of abstraction involved, it is the dependency tracking and adjacency list detection during command recording where most problems arise. The relationships shown in the diagrams above were not specified by the programmer using RenderingDevice: they must be detected automatically based on how the resources were used in the frame, and this turned out to be no small task due to some particular details of how Godot works.
Resource tracking
The resources used by RenderingDevice in Godot are buffers or textures. While these are separate objects at the lower level depending on the API being used, the graph considers them both as one to share much of the logic during implementation. However, a distinction will be made later when texture slices are introduced, which is something Godot uses quite a bit in various parts of its rendering code. Textures also have the additional requirement that they need to make layout transitions to be ready for use in different commands, while buffers don’t need to do this at all.
Whenever a resource is created, a new “tracker” structure is introduced to store the information relevant to the graph construction during command recording. The tracker holds references to which commands are writing or reading from the resource and modifies these lists accordingly as more commands are recorded. It also stores a “usage” variable that indicates what the current use of the resource is at the time of recording. Usages are both classified as “read” or “read-write” operations, and which one is used has strong implications for how dependencies between commands will be detected. For example, a command that reads from Resource A can be executed in parallel with another command that reads from Resource A, but that will not be valid if the other command can write to Resource A. In this case, a dependency is inserted between the two commands to ensure that the first command can finish reading the resource correctly before the next command modifies it.
| The tracker holds the current usage of a resource and determines whether it is necessary to perform a transition based on the type of command that references it. |
Textures also have a particular requirement: changing the usage implies a memory layout transition even if it’s just for read-only operations. For example, there’s different layouts for a texture being used as the source of a copy operation and for a texture being used for sampling in a shader. While this distinction might not necessarily be true at the hardware level, it is actually possible to witness texture corruption if these transitions are not performed correctly depending on the GPU’s architecture (AMD is really good for testing these out!). Therefore, any change in usage when textures are involved is usually considered a write operation as most of them require a particular layout. This introduces some dependencies between commands that might not be very obvious but are completely required for the operations to work correctly: continuing with the previous example, it’s not possible to use the optimal memory layout for copying a texture and sampling it in a shader in parallel, even if both are read-only operations.
Dependency tracking
Since the graph construction is automatic and there’s no input from the programmer in how the adjacency lists of the graph must be built, it’s up to RenderingDevice to use the resource trackers to figure out the dependencies between commands. While the final implementation is a bit more complex due to the introduction of texture “slices” (which is covered in another chapter), the main idea behind the algorithm is pretty straightforward.
- When a command uses a resource as read-only, a reference to the command is stored in a list in the resource tracker. A reference to the command is placed on the adjacency list of the last operation that wrote to the resource.
- When a command uses a resource as read-write, a reference to the command is stored the resource tracker, replacing the previous one and clearing the list of commands that were reading from the resource. A reference to the command is placed on the adjacency list of all operations that were either reading or writing to the resource.
- An exception is made for textures: if an operation must change the type of usage, the operation is considered as if it’s writing to the resource because a memory layout transition is required. It does not matter if both operations are read-only: a write dependency will be established regardless. This is worth keeping in mind as the graph considers the operations to be dependent if the texture’s usage changes often.
| Animated example of how dependency tracking is used to build the graph. Blue and red represent how the command modifies the lists inside the trackers and green indicates which values it reads from to build the adjacency list. |
Older operations are discarded from the tracker’s lists to avoid increasing them endlessly and causing performance bottlenecks in the process. As write operations can’t be done in parallel and no information is known about the range of data that is modified (a potential future improvement), then it’s only necessary to store a reference to one command at all times. This system requires more detailed tracking once texture slices are later introduced, but the strategy remains largely the same.
One interesting thing to note here is that Godot can leverage the information provided by SPIRV-reflect to identify the usage of some resources as read-only even if their layout allows write operations. For example, the storage memory layout is required to be able to write to a texture directly so it is considered as a write usage by default. However, if the GLSL shader uses the readonly qualifier on the binding, then the graph will consider it as a read operation.
Immutable resources
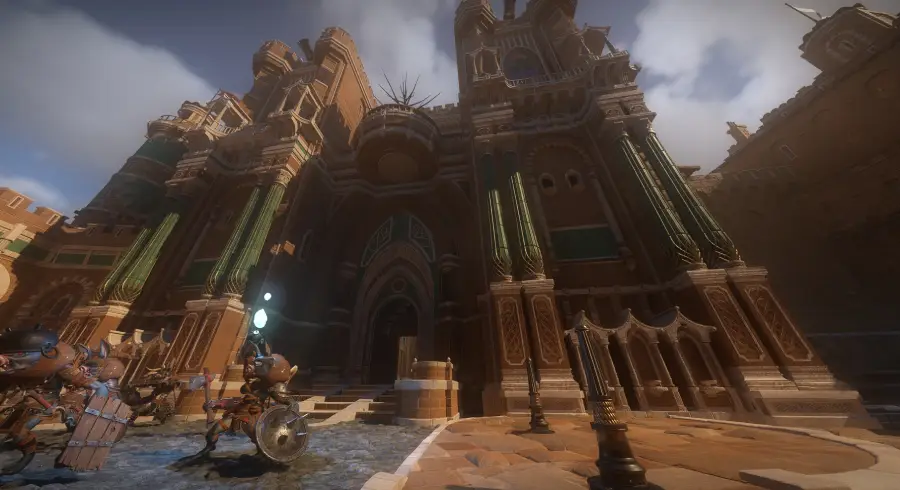
Resource tracking can quickly become a performance bottleneck as the solution does not scale effectively to games with large amounts of resources. If every single buffer or texture used in a frame must be tracked and checked for dependencies during recording, that can quickly balloon out of proportion. But there is a simple first step to reduce this problem: not everything needs to be tracked as most resources in a game are usually static (e.g. terrain or buildings). An internal benchmark scene from W4 Games showed this to be true pretty quickly, as the amount of trackers went down from over 20 thousand to less than a thousand after ignoring all static resources.
But Godot doesn’t currently know what resources are static. Users can modify these resources freely at any time, even from GDScript! Resources are not considered to be immutable or marked as such during the import process. Other engines typically mark nodes as static for additional optimizations, but Godot avoids this concept to keep the engine easy to use and not overwhelm beginners with settings whose purpose they may not yet understand. This turned out to be a big problem that was debated internally for a while, as introducing a new “immutable” attribute was the most attractive option with the downside that it would mean a lot of extra work for end users.
 |
|---|
| Complex game scenes often contain a lot of static geometry. Tracking these resources generates a lot of overhead without any real benefit. |
Fortunately, a quick solution was found that allowed trackers to be greatly reduced without the need for user intervention: during resource creation, a couple of flags are checked to see if a tracker should be created or not. If the resource is created with some initial data and no explicit flags are set for modification, then it is considered to be read-only and no tracker is created for it. If at some point an operation attempts to modify the resource, a full synchronization is introduced in the graph and the tracker is created. Synchronization is required because it’s not possible to know which commands in the frame were reading from the resource beforehand. Full synchronization implies all previous commands must be adjacent to the command that created the resource tracker, so the graph degrades to the behavior of the previous version of Godot on that particular command for one frame. This was considered to be an acceptable and very minor performance degradation that bypassed the need to introduce the “immutable” flag to the engine.
Texture slices
No good tale is complete without its villain. This was the most painful omission from the initial design and it proved to be the hardest part of dependency tracking and texture layout transitioning that required to be solved. As a matter of fact, it might not even be solved completely yet as new edge cases that had to be fixed popped up even after the graph was merged!
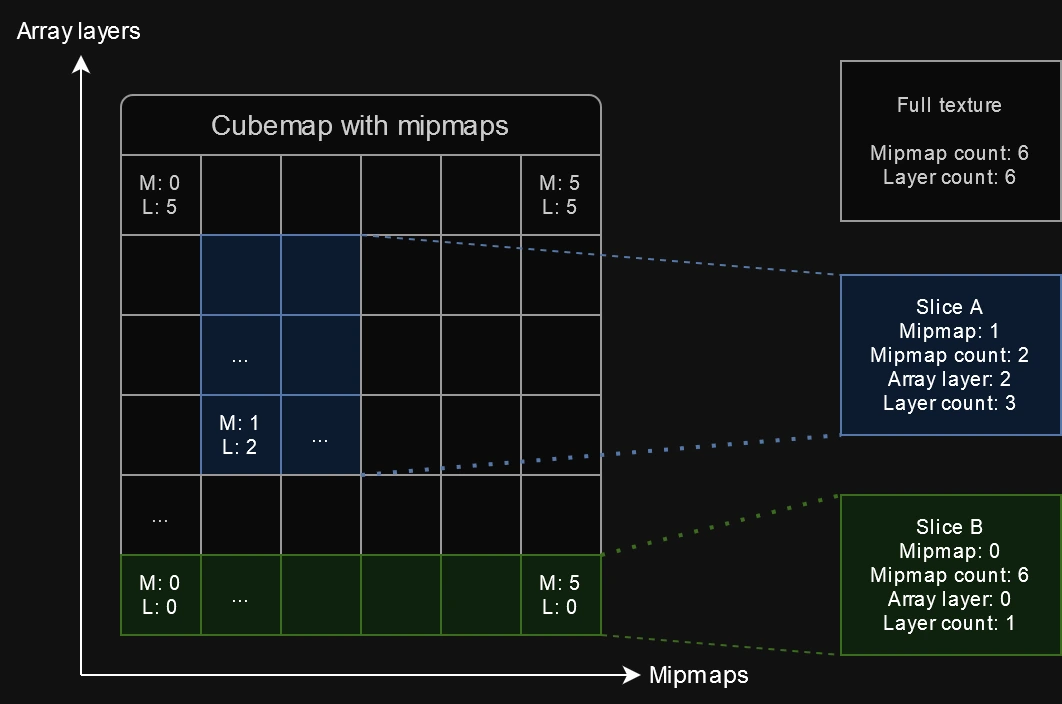
While textures are most commonly associated with containing two dimensions, it is possible to create two extra dimensions that further complicate their use: mipmap levels and array layers. Mipmaps are commonly used to create a chain of smaller versions of the texture that the filtering process can use to improve the image quality (see Anisotropic filtering). A general use case for array layers is to simply create a texture with the same dimensions multiple times and then reference a particular layer within a shader. Godot makes plenty of use out of these extra dimensions, even combining the use of both at the same time for some effects.
This usually doesn’t pose any additional trouble if the engine sticks to using a texture during commands in only one particular way, but the problem does not stop there: Godot can and will use different parts of the same texture for completely different purposes, even within the same command. This is possible because RenderingDevice can create “shared” textures from slices. While the original texture may only have one resource tracker, all shared slices are considered different textures with their own resource trackers that can be referenced independently in commands. A common use case is mipmap creation: a lower level mipmap of the texture can be set as the render target, while a higher resolution level is used for sampling, effectively creating the chain of mipmaps from the texture’s highest quality level.
 |
|---|
| The anatomy of a cubemap texture that uses both mipmaps and array layers. Godot can create slices of a texture that reference only a range of its subresources. |
Tracking texture slices effectively required the implementation of a set of strict rules to verify that the programmer using the RenderingDevice does not perform operations with undefined behavior.
- The tracker for the “parent” texture holds a “dirty list” of slices that have a different memory layout from the one used by the parent.
- It is never possible for slices on the dirty list to overlap. In fact, these ranges are represented as 2D rectangles, which is pretty fun way to represent the problem visuallly!
- The tracker for a texture slice holds a reference to its parent and a flag to identify whether it is present on the dirty list or not.
- It is not possible for one command to use slices of the same texture that overlap, as this can lead to undefined behavior. This restriction is applied even if their usage is the same.
- If the parent texture is used in a command directly, all slices in the dirty list will be reverted to the usage of the parent by “normalizing” the texture to one memory layout. It is not possible to use slices with a different usage during this step.
- Slices present in the dirty list can also be normalized and removed individually if a new command wants to use a slice that would overlap with their dirty region. Since it’s not possible for slices to overlap in the same command, this operation can always be performed safely if the slice being normalized was used in an older command.
- Dependency tracking is performed strictly with the tracker associated to the parent texture of a slice and not the slice’s tracker, as this usually leads to the safest behavior.
While these rules do not guarantee an optimal solution, it is not common for Godot to perform these operations on every frame, and the potential linearization of the commands is an acceptable performance hit to keep tracking as simple as possible. One point in particular that was discussed a lot was whether to resort to tracking usage individually per mipmap level and array layer, but such a decision would result in a system that wouldn’t scale at all in the long run if large texture arrays with multiple mipmaps are used.
Results
While this is something that is not usually measured, it’s worth remembering one of the main reasons behind the graph was to simplify the maintenance of the rendering code for the team. The problems identified at the start clearly meant there was a lot of code that would get deleted from the rendering pipeline. While the PR might not have ended up in the net negative due to a lot of code being isolated in the graph’s class along with debugging utilities, around ~2,500 lines of code were removed from the implementation of RenderingDevice, the Forward+ renderer and the Mobile renderer.
The other major benefit is that a lot of hard to identify bugs that were caused due to synchronization bugs are now potentially fixed. As pointed out before, the MSAA with SSAO issue was resolved as a side effect. Problems like this one proved to be extremely hard to fix as Godot developers would require the particular set of hardware and the right scenarios for the defects to trigger. With the graph sufficiently complete and unable to cause these synchronization problems, the possibility of introducing errors of this kind disappears.
GPU performance
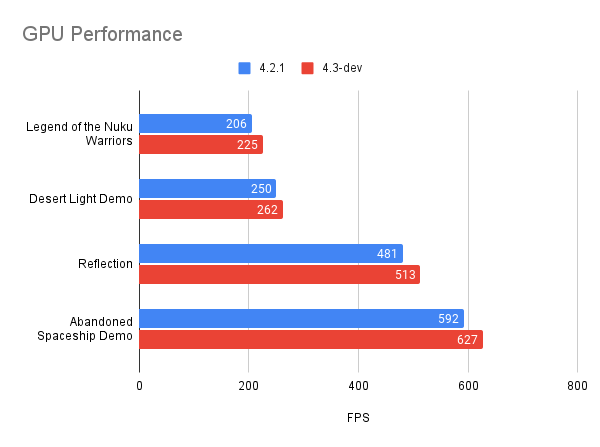
The results are generally positive. No performance regressions have been identified in any scene as far as GPU performance is concerned, and in virtually most scenarios an improvement can be expected depending on their contents.
 |
|---|
| Results gathered from running various projects with an NVIDIA GeForce RTX 3090 Ti at 1920x1080. Higher is better. |
- Legend of the Nuku Warriors: Internal demo scene by W4 Games.
- Desert Light Demo by RPicster.
- Reflection for Godot 4.0 ported by Calinou.
- Abandoned Spaceship Demo by Perfoon.
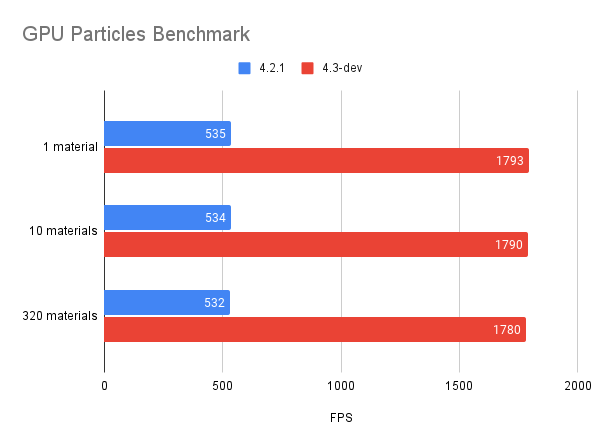
The biggest gains by far could be identified in projects with multiple GPU particle systems, where the execution can now take place in parallel wherever it’s possible. A dedicated particles benchmark makes this difference much more obvious.
 |
|---|
| Results gathered from running the benchmark with NVIDIA GeForce RTX 3090 Ti. Higher is better. |
CPU performance
The introduction of the acyclic graph to Godot does not come free. As the need to serialize commands into an intermediate buffer is introduced along with graph construction, dependency tracking, and sorting, the CPU must bear the brunt of the work. However, the results are not what most developers would expect. From profiling where the CPU spent most of its time during a frame in the benchmark scene, the following was discovered:
- Graph construction and topological sorting don’t even account for more than 1% of the CPU time of the frame. The node count is usually too low to have a significant effect.
- Nearly 30% of the CPU time was consumed entirely by Vulkan API calls (~20%) and serialization of the commands into the draw list (~10%). This corresponds to the fact this scene has a massive amount of objects being drawn with a large amount of omni lights that can cast shadows.
For now, the conclusion would seem to be that the graph itself cannot impact the scene significantly as far as CPU overhead is concerned, but the requirement to serialize large draw lists seems to simply exacerbate an existing problem: Godot needs better mechanisms to merge draw calls and avoid binding an excessive number of index buffers and unique vertices for everything in the scene. The good news is that this regression can potentially be mitigated or even improved in the short term with secondary command buffers (or a suitable replacement).
Secondary command buffers
As mentioned before, the new APIs enable the possibility of recording to command buffers from multiple threads. Secondary command buffers are an interesting subset of command buffers that aren’t capable of recording all types of commands and are intended to be inserted inside a render pass issued in a primary command buffer. This is actually an ideal application for draw lists, since their contents do not need to be reordered, but their location in the primary command buffer is determined during the topological sorting step of the graph. Therefore, they enable the possibility of recording in parallel and ahead of time the largest draw lists of the frame. And they actually get good results! In the benchmark scene, the CPU time spent in the frame is actually reduced compared to 4.2 thanks to overlapping most of the cost from calling the Vulkan API and delegating it to background worker threads. The graph finally gives Godot the keys to using multithreading for rendering!
So why is this not enabled in master yet? It seems that secondary command buffers can run into some strange issues on different hardware and are not as widely supported as they should be. During testing an issue was found in NVIDIA GPUs where the editor window would just go completely blank if secondary buffers were used under certain conditions. Apparently it wouldn’t be the smartest decision to rely on this feature and expect it to work correctly on most platforms. However, if you want to experiment with it yourself the code is currently present behind a compilation macro. The code will automatically enable multithreaded recording when the draw lists are determined to be large enough to be suitable and will result in a real reduction in CPU times in demanding scenes, provided the user has enough CPU cores to handle it.
An alternative being evaluated is to record multiple primary command buffers instead and chain them together when the frame ends. However, submitting a command buffer for execution has a fixed cost that isn’t insignificant according to hardware vendors, so some consideration must be given to creating different command buffers only when the benefit outweighs the cost.
Future work
With the introduction of the directed acyclic graph and with a few more abstraction rewrites coming down the line, the engine will now have access to even more optimizations that can be implemented in the future.
Multiple queues
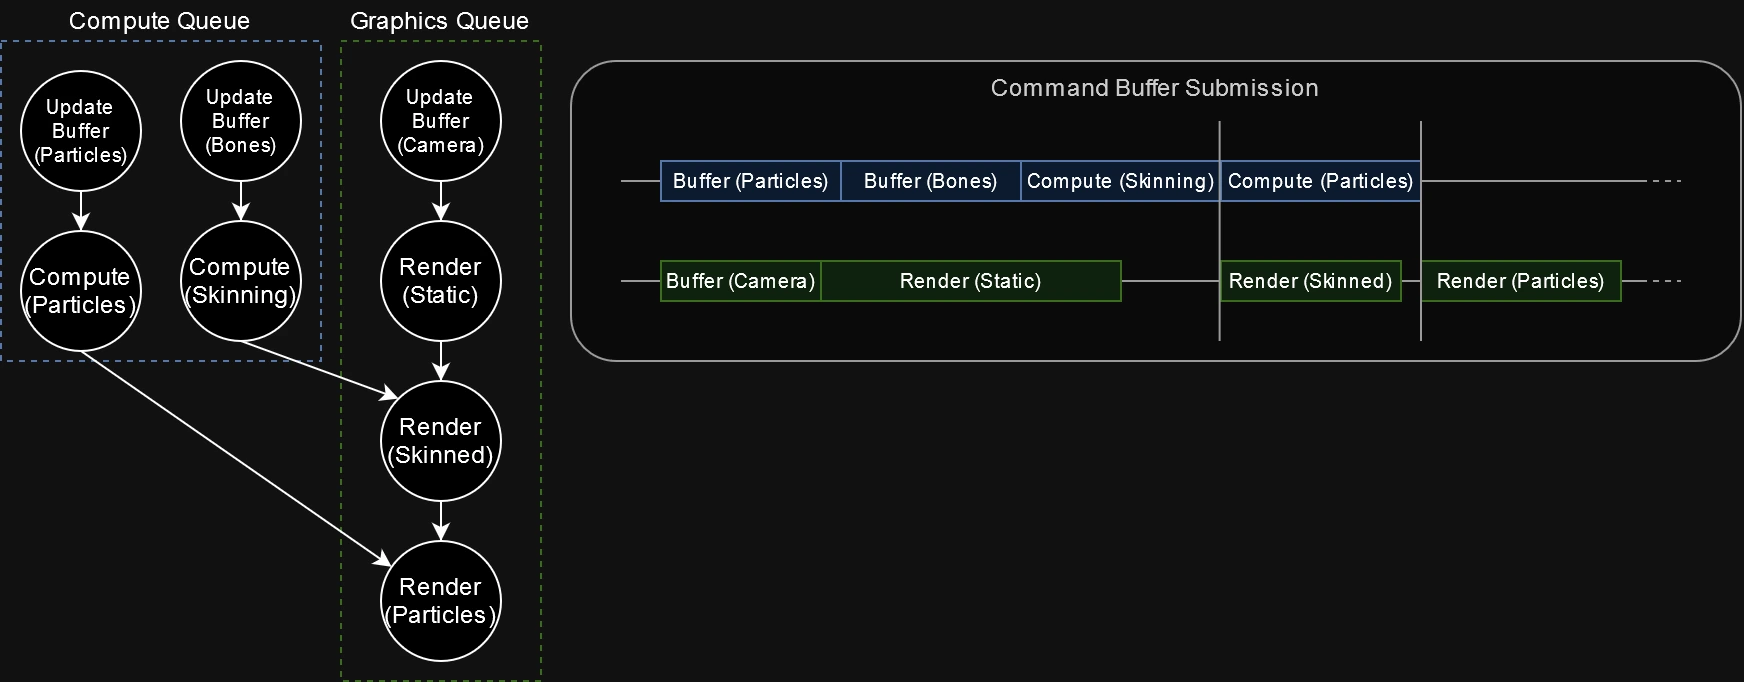
Pavlo Muratov’s article that was used as the main inspiration behind this change contains a very interesting proposal in how to submit and synchronize GPU work across the multiple queues exposed by the hardware. Godot could potentially leverage these extra queues (e.g. dedicated compute queues), to be more explicit about what work should be executed in parallel. Finding paths that could be executed in parallel in the graph would require some elaborate detection of the dependencies between the commands, the possible paths that are independent and where the synchronization points need to be placed.
 |
|---|
| A heavily simplified example of a potential multiqueue submission scheme that could be detected by the graph. Many portions of the compute work in Godot could be processed while other parts of the rendering pipeline are busy. |
As pointed out before when talking about using primary command buffers as an alternative to secondary command buffers, command queue submissions are not free: there must be a good balance between partitioning work to be executed in parallel when compared to just submitting everything into a single command queue.
MSAA resolves
Multisample anti-aliasing (MSAA) is a feature that requires explicit commands to “resolve” the result of the anti-aliasing into a texture that can be used by other steps in the rendering pipeline. The anti-aliased result is not actually computed during the time of drawing but either when a resolve command is issued or a render pass defines a resolve operation in a subpass.
 |
|---|
| It’s not possible for Godot to know if something will draw again to the target, so it must resolve the result manually when it needs to sample the resource. |
With how flexible of an engine Godot is, determining where this step should go can be very tricky: the operation should be placed only when it’s absolutely necessary or as part of the last render pass that draws to the MSAA texture. This is an area that the graph could aim to resolve automatically by simplifying the implementation of MSAA in the renderers and lead to further performance improvements. Reducing the amount of resolve operations to the minimum and the bandwidth required for MSAA could be very beneficial for the Mobile renderer in particular.
 |
|---|
| Since the graph can detect if the render pass is the last one in the frame, it can automatically insert a resolve in the render pass, saving lots of bandwidth in the process. |
Graph visualization
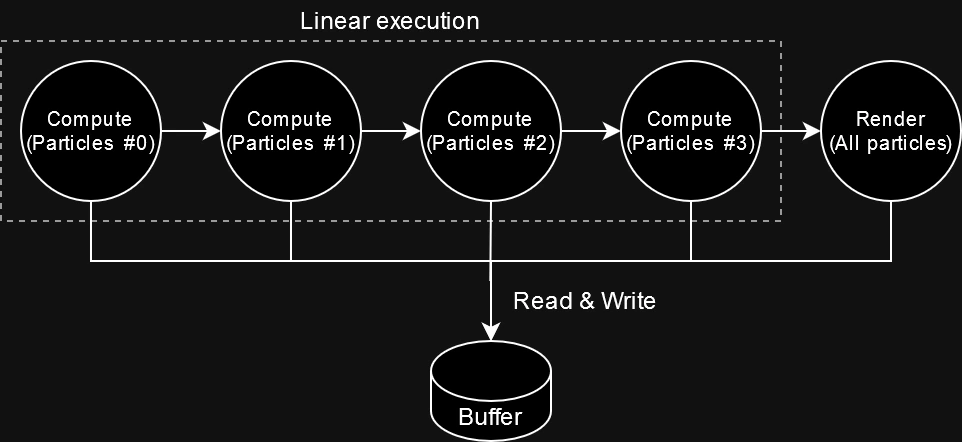
While this wouldn’t provide a direct benefit to end users, building a visualizer for the graph could help the Godot developers have a clear overview of the rendering pipeline of a given frame and identify bottlenecks more easily. During development, a few compute passes were identified that weren’t being parallelized correctly due to implementation errors. For example, GPU particle systems were binding an unused buffer for write operations even if they never wrote to it, which led to the commands being identified as being dependent of each other due to having to synchronize with the potential “write” performed by the previous system.
 |
|---|
| Due to an implementation error, even after implementing the graph, the execution of the particle systems was mostly linear, as they all reused the same temporary buffer for reading and writing. |
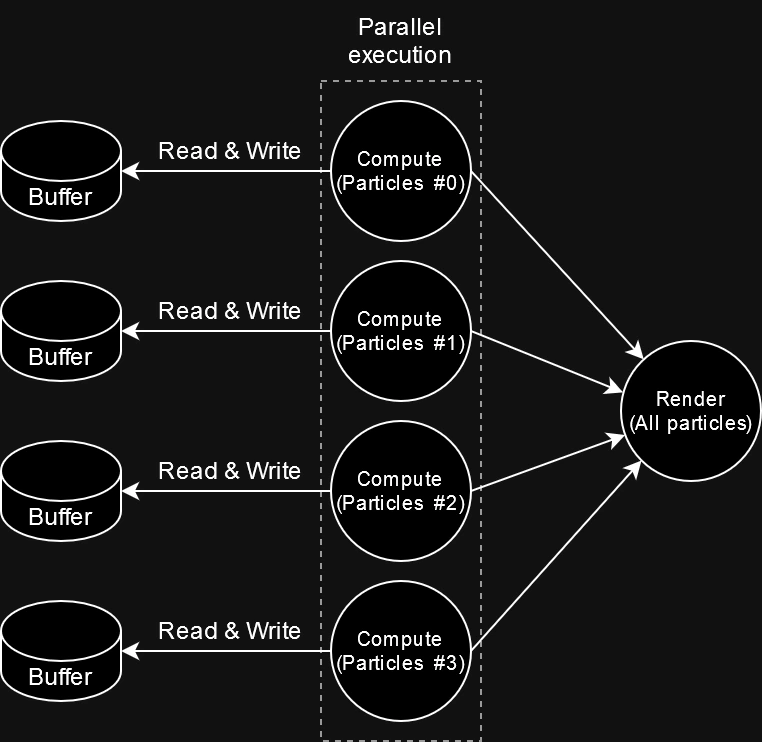 |
|---|
| After fixing the error by assigning each system their own buffers, the graph automatically reordered and executed the particle systems in parallel, leading to huge gains in performance. |
While a more obvious case like this one was identified since it did not meet expectations at first, there could be more subtle instances of this behavior yet to be found in the codebase that could be easily exposed by building better debugging tools.
Conclusions
While the use of a directed acyclic graph for rendering is not a brand new technique, the approach used by Godot is quite novel in many ways. The simplicity of the API exposed by RenderingDevice no longer comes at the cost of rendering performance: the developer is guaranteed they’ll get efficient use of the GPU and it can only get better from here. As the engine aims to be as general purpose as possible and maintain its ease of use, a lot of alternatives had to be discarded until the right approach was found. This is a long-term technical investment that will pay off by reducing the cost of maintenance and unlocking new strategies for optimization in the long run.
An automatic approach ensures that despite the project being open source and modified by many different people, they no longer need complete awareness of how the entire rendering pipeline works to modify it. This will also be very beneficial when PRs like rendering effects are merged, which introduce the ability to add post-processing steps where the Godot renderer will be completely unaware of all dependencies the hook may require. The extra validation introduced by recording commands to the graph has also exposed existing implementation errors, resulting in either bug fixes or even performance improvements.
Debugging is the weak point of this approach: when dealing with native Vulkan or D3D12 code, it can be very tough to produce a usable backtrace as the context that generated the commands is long gone by the time they’re translated from the auxiliary buffer to the native API calls. It is advised to build very good debugging tools that register as much information as possible to aid in the process. This is one area where the existing implementaton must be improved upon.
Considering how little abstraction the graph requires, it is entirely possible to apply this approach to other projects that don’t use Godot at all. The implementation of the technique has been kept as isolated and general purpose as possible, affecting very little of the rest of the Godot codebase except for removing code that is no longer required. Following this approach turned out to be very important, as being able to change the implementation of the graph itself or disable it completely was vital to debugging any problems introduced by implementation errors. While there are no plans to make this a general-purpose library, it could be a very interesting idea to integrate this mechanism into a generic rendering framework.
Look forward to testing this feature out in the 4.3-dev snapshots and future releases! Please let us know if you have any issues so they can be fixed in time for the first stable release.
